Stripe Template Donut Chart – Stylish Visual Data Representation
RB0800010_8
- Last Update 03/19/2025
- File Size 1.5MB
- # of Slides 2
- File Format PPTX
- Slide Ratio 4:3
- Color
Keywords
About the Product
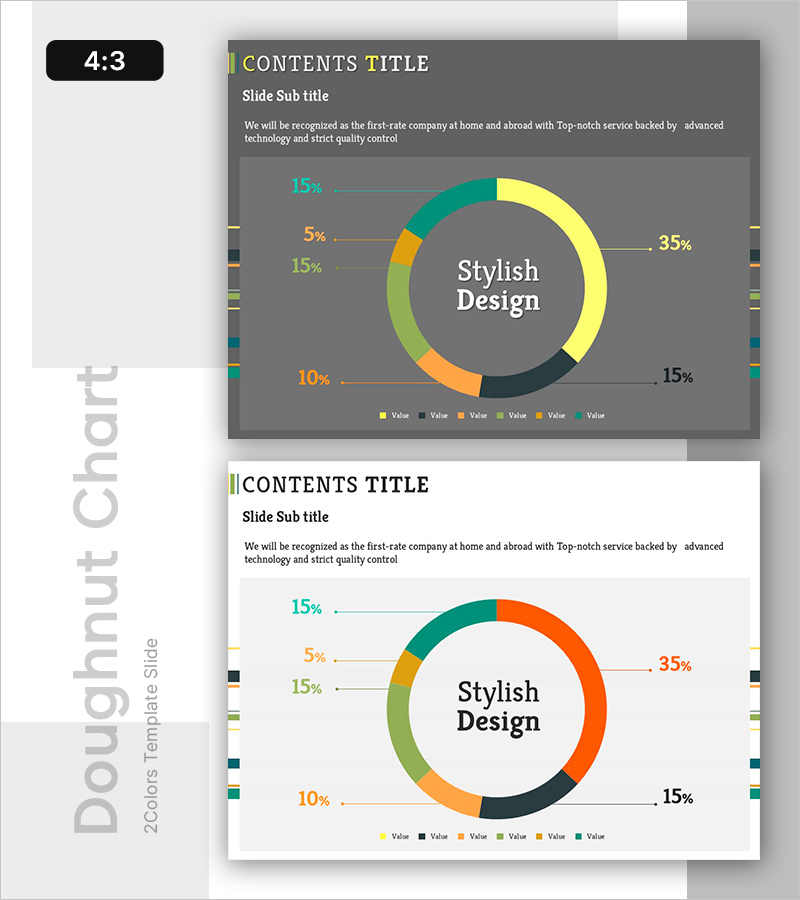
A PowerPoint slide featuring a 6-segment donut chart that visualizes proportional data with multicolor segments in teal, yellow, orange, and olive tones on a dark gray background. Each segment displays percentage labels, with a central text area for key messaging. Ideal for presenting product composition, market share, budget allocation, customer satisfaction, or organizational structure. The 4:3 aspect ratio template includes 2 slides ready for immediate editing.
Usage Points
-
Main Usage
Visualizes proportional data across 6 categories—product composition, market share, budget distribution, customer satisfaction, or organizational breakdown. The central space emphasizes the chart's main theme while segments display comparative percentages.
-
How to Use
Apply in business presentations, marketing reports, financial statements, and strategy meetings to explain compositional ratios. Replace percentage values and legend items with your own data for immediate use in professional settings.
-
Recommended For
Marketing professionals, financial analysts, executives, consultants, and educators presenting quantitative data. Best suited for situations requiring intuitive comparison of component sizes and relative proportions.
-
Slide Structure
One 6-segment donut chart with percentage labels per segment, central text input area, and bottom legend displaying 6 items. Both slides maintain identical layout for consistency.
Related Products
-

Sales Profit Analysis Table & Graph – Visualizing Financial Planning and Performance
#Financial Plans and Performance #Diagram #Graph
-

Horizontal Bar Ratio Graph – Visual Data Presentation
#Graph
-

Horizontal Bar Graph for Product Performance Analysis
#Market and Competitor Analysis #Financial Plans and Performance #Graph
-

Visualization of Competencies and Team Members – Insightful Horizontal Bar Graph
#Company Introduction #Graph #Manpower
