Green Standard Table – Financial Planning and Budget Analysis
RB0800010_12
- Last Update 03/19/2025
- File Size 1.4MB
- # of Slides 2
- File Format PPTX
- Slide Ratio 4:3
- Color
Keywords
- #Content-Based Slides
- #Design-Based Slides
- #Financial Plans and Performance
- #Diagram
- #Budget
- #Key Financial Indicators
- #Table
- #Standard Table
- #4:3
- #data table PowerPoint slide
- #financial table template
- #budget analysis slide
- #teal table design
- #spreadsheet slide template
- #financial data presentation
About the Product
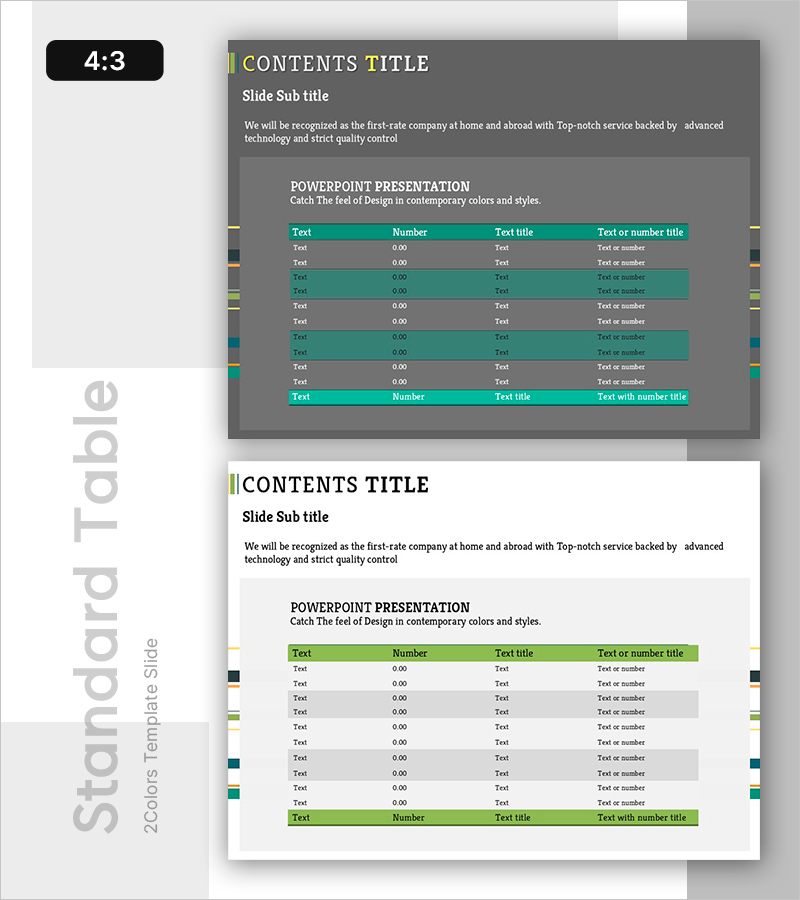
A four-column, ten-row table PowerPoint slide designed for financial planning and budget analysis presentations. The slide features a dark gray background with a teal-green header row and white text, optimizing readability for numerical data. The header and footer rows are highlighted in teal to emphasize key financial metrics, while data rows maintain a neutral gray background for clear visual hierarchy. This 2-slide set (4:3 aspect ratio) provides consistent table layouts for presenting financial indicators, budget line items, quarterly performance, and cost breakdowns. Ready to edit and deploy in financial reports, business plans, and investment proposals.
Usage Points
-
Main Usage
Present financial data, budget allocations, quarterly results, and cost structures in a clear, organized table format. The teal header and footer rows draw attention to summary figures and key metrics, making numerical comparisons easy for audiences to follow.
-
How to Use
Insert this table slide into financial reports, business plans, investment proposals, and quarterly performance reviews. Simply replace placeholder text and numbers with your actual financial data. Rows and columns can be added, removed, or reformatted to match your specific data structure.
-
Recommended For
CFOs, financial analysts, business planners, and investment managers presenting financial performance, budget forecasts, and cost analysis. Ideal for banking, insurance, manufacturing, retail, and any data-driven organization requiring professional financial presentation slides.
-
Slide Structure
The table contains 4 columns (Text, Number, Text title, Text or number title) and 10 data rows. The header row and footer row feature a teal background with white text for emphasis. Data rows use a gray background to maintain visual separation. Both slides in the set share identical layouts, ensuring consistency across multi-slide financial presentations.
Related Products
-

Key Financial Indicators for Animal Nature Conservation Programs – Effective Budget Management
#Financial Plans and Performance #Diagram #Budget
-

Travel Table Text Box – Visualizing Financial Plans and Outcomes
#Financial Plans and Performance #Diagram #Budget
-

Table of Major Financial Indicators – Optimized for Performance Analysis
#Financial Plans and Performance #Diagram #Budget
-

Red Purple Highlight Table – An Ideal Choice for Financial Planning
#Financial Plans and Performance #Diagram #Budget
