Table of Major Financial Indicators – Optimized for Performance Analysis
RJ0600028_8
- Last Update 06/28/2025
- File Size 3.9MB
- # of Slides 2
- File Format PPTX
- Slide Ratio 16:9
- Color
Keywords
- #Content-Based Slides
- #Design-Based Slides
- #Financial Plans and Performance
- #Diagram
- #Budget
- #Key Financial Indicators
- #Table
- #Standard Table
- #16:9
- #financial indicators table PowerPoint
- #financial performance analysis presentation
- #table slide template
- #financial data visualization
- #performance management PPT slide
About the Product
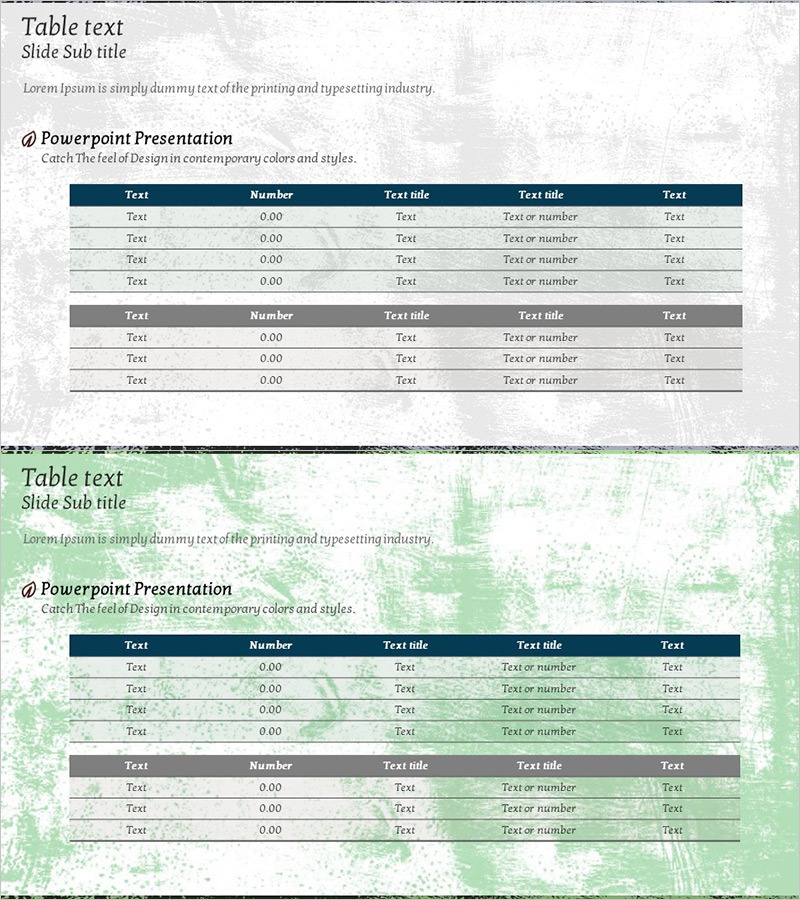
A 5-column financial data table PowerPoint slide designed to present performance metrics systematically. Features a dark blue header row and light beige data rows that clearly display financial indicators, numerical values, and descriptive text. This 2-slide set includes two layout variations—top header style and mid-header style—ready for immediate use in presentations and reports. Each row separates text and numeric input areas, making it ideal for visualizing financial planning, cost forecasting, and performance management data with clarity and structure.
Usage Points
-
Main Usage
Presents financial performance metrics in tabular format for clear communication to executives, investors, and stakeholders. Structures key financial indicators (revenue, profit, ROI), quarterly or annual comparisons, and budget-versus-actual analysis in an organized table format to support credible reporting.
-
How to Use
Insert into business plans, investor pitch decks, quarterly performance reports, and financial analysis presentations in the financial data section. Enter actual figures and item names into each cell, and adjust colors as needed to highlight key metrics. Select from 2 slide layout options based on document structure.
-
Recommended For
CFOs, finance managers, executives, and investor relations professionals presenting financial performance. Suitable for startup fundraising, corporate quarterly earnings presentations, financial consulting reports, and bank or financial institution loan application materials.
-
Slide Structure
2-slide set with 5 columns (text, number, text title, text title, text) and 4 data rows per slide. Top slide features dark blue header; bottom slide uses mid-gray header for section variation, allowing flexible application across different document sections.
Related Products
-

Key Financial Indicators for Animal Nature Conservation Programs – Effective Budget Management
#Financial Plans and Performance #Diagram #Budget
-

Eco-friendly Business Budget Table Chart - Simple and Functional Design
#Financial Plans and Performance #Diagram #Budget
-

Eco-friendly Business Project Main Financial Indicators and Budget Table
#Financial Plans and Performance #Diagram #Budget
-

Financial Indicator Text Table – Financial Performance Analysis
#Financial Plans and Performance #Diagram #Budget
