Table Charts for Exercise – Market Analysis and Performance
RJ0600021_10
- Last Update 06/26/2025
- File Size 2.8MB
- # of Slides 2
- File Format PPTX
- Slide Ratio 16:9
- Color
Keywords
- #Content-Based Slides
- #Design-Based Slides
- #Market and Competitor Analysis
- #Financial Plans and Performance
- #Diagram
- #Customer Analysis
- #Cash Flow Statement
- #Table
- #Standard Table
- #16:9
- #table chart PowerPoint
- #table slide template
- #market analysis chart
- #performance comparison slide
- #data visualization presentation
About the Product
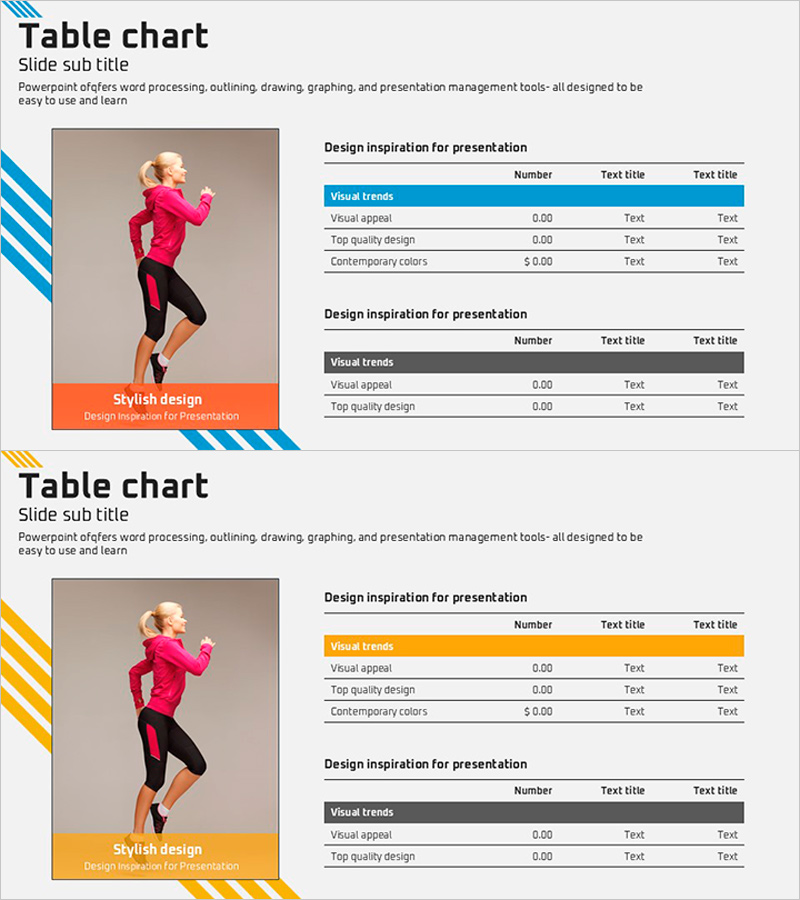
A 3-row table chart PowerPoint slide designed for analyzing exercise industry market data and performance metrics. This 2-slide presentation template features four comparison categories: Visual Trends, Visual Appeal, Top Quality Design, and Contemporary Colors. The slides use a blue header row and orange accent banner to organize and highlight key information, making it ideal for business presentations on fitness market conditions and performance results. Fully editable PPTX template ready for immediate use in your presentation.
Usage Points
-
Main Usage
Visualizes market analysis data, performance metrics, and business status in structured table format. Clearly presents numerical and textual information to enhance audience comprehension and decision-making based on data-driven insights.
-
How to Use
Input different analysis items into slides 1 and 2 to present market conditions and performance sequentially. Edit the header row labels (Visual Trends, etc.) and data cells with your own numbers and text to customize the presentation for your specific content.
-
Recommended For
Fitness industry professionals, sports marketing managers, business performance report presenters, and market analysts. Suitable for investor presentations, business reports, marketing strategy pitches, and quarterly performance reviews.
-
Slide Structure
2-slide layout with 3-row (header + 2 data rows) × 3-column tables on each slide. Blue header row and white data rows provide clear visual separation. Orange accent banner on the left side displays 'Stylish Design' text for visual emphasis and brand consistency.
Related Products
-

Slide Template for Sports Data Analysis – Understanding Market Trends and Information
#Market and Competitor Analysis #Financial Plans and Performance #Diagram
-

Triangular Pattern Presentation Table - Financial Plans and Performance
#Financial Plans and Performance #Diagram #Balance Sheet
-

Perfect Presentation Template for Financial Performance Visualization with Table Design
#Financial Plans and Performance #Diagram #Cash Flow Statement
-

Circular Gradient Table – Financial Performance and Differentiation
#Financial Plans and Performance #Diagram #Balance Sheet
