Visualization of Korean Region Characteristics – Exploring Various Possibilities
RB0800003_5
- Last Update 03/17/2025
- File Size 0.3MB
- # of Slides 2
- File Format PPTX
- Slide Ratio 4:3
- Color
Keywords
About the Product
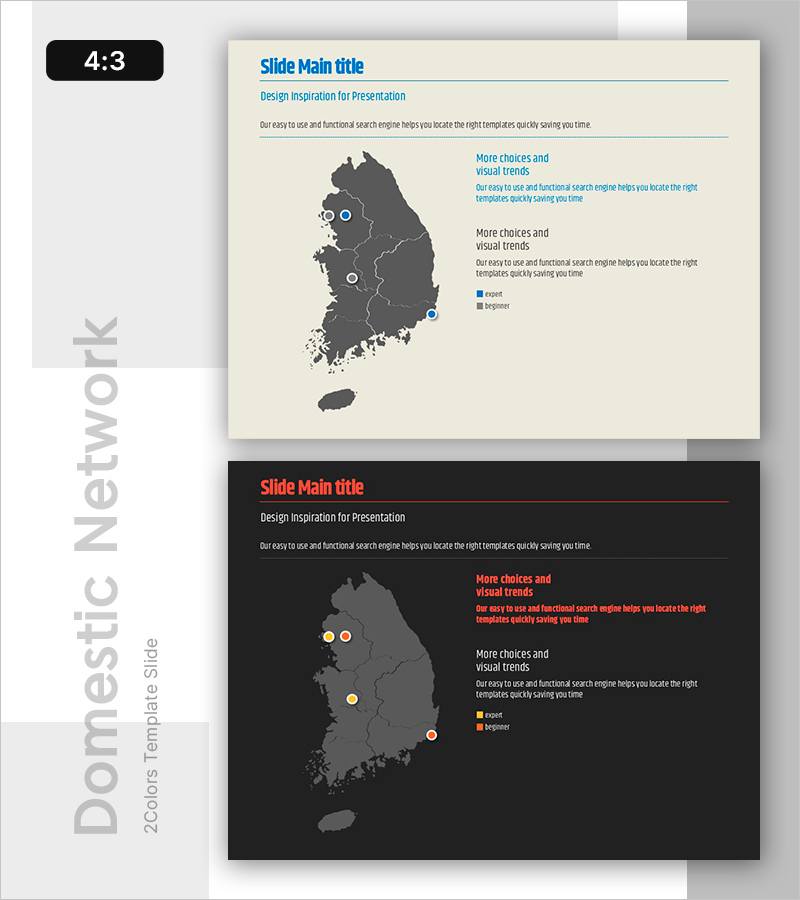
A PowerPoint slide that visualizes Korea's regional characteristics using a geographic map with circular markers and text annotations. Two color versions are provided: beige background and black background. Each slide features a Korea map on the left side and a text area on the right side for effective regional information delivery. This presentation slide is ready to use for government agencies, regional development projects, and market analysis presentations, enabling quick comparison of regional characteristics.
Usage Points
-
Main Usage
Visualizes Korea's regional characteristics, market conditions, and business distribution using a map-based approach to enhance audience understanding. Ideal for government policy presentations, regional development projects, and marketing market analysis where regional information needs to be communicated intuitively.
-
How to Use
The Korea map is positioned on the left side with circular regional markers, while the right side contains text areas and a legend. You can customize by changing marker colors, editing the text boxes on the right to add regional descriptions, statistics, or business details, and adjusting the legend as needed.
-
Recommended For
Regional policy officers, regional development project managers, marketing analysts, government agency planning teams, and professionals in real estate, tourism, and retail industries presenting regional status to audiences.
-
Slide Structure
Two-slide layout with each slide divided into 50% map area (Korea map with regional markers) and 50% text area (title + 2 text boxes + legend). Offers two color options: light beige background and dark black background for flexible presentation design.
Related Products
-

Project Overview PowerPoint Slide – 4-Spec Dark Real Estate
#Product/Service Introduction #Business Strategy #Diagram
-

Plogging Route Presentation Slide – 9-Point S-Curve Timeline
#Company Introduction #Business Strategy #Corporate Social Responsibility
-

Contact Closing PowerPoint Slide – Interior Dark Two-Column
#Company Introduction #Contact Information
-

Problem Definition PowerPoint Slide – 4-Step Flow Diagram
#Company Introduction #Business Strategy #Diagram
