Geographical Data Visualization Slide for Effective Communication
RB0800003_19
- Last Update 03/17/2025
- File Size 0.6MB
- # of Slides 2
- File Format PPTX
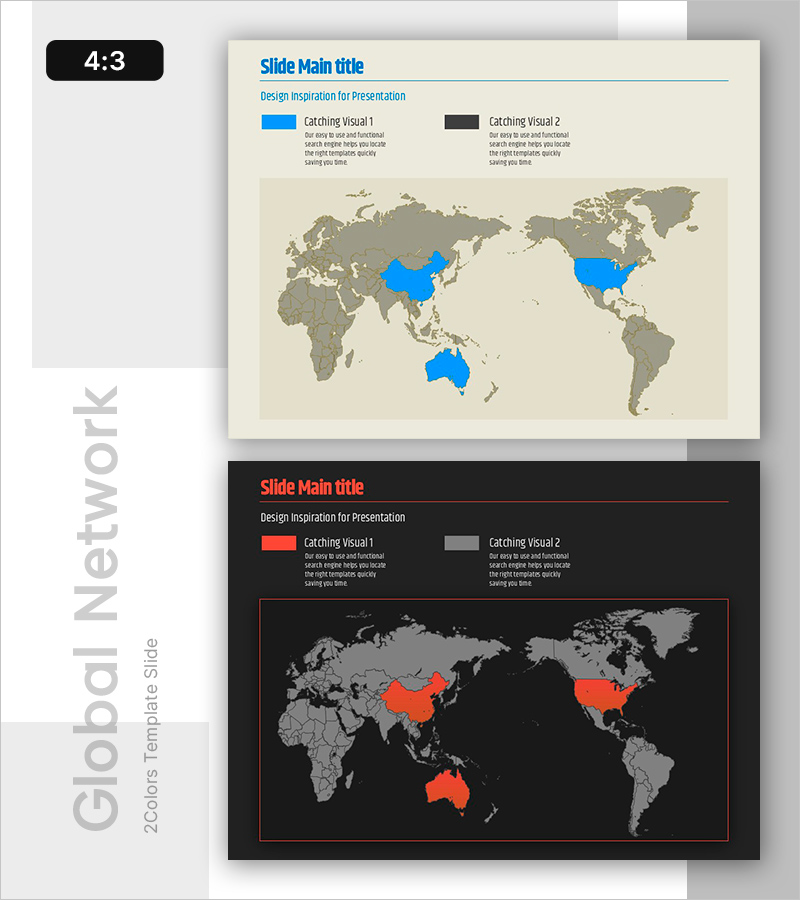
- Slide Ratio 4:3
- Color
Keywords
About the Product
A PowerPoint slide that visualizes geographical data by country with two color-coded design options. The beige background version features blue highlights, while the dark background version uses orange accents to emphasize selected countries on a world map. This dual-option approach allows flexible presentation styling for different business contexts. The slide includes legend areas and text fields for customization, making it ideal for communicating global business expansion, market distribution, and international strategy. Perfect for investor presentations, market analysis reports, and global expansion planning sessions.
Usage Points
-
Main Usage
Visualize country-by-country business presence, global network distribution, and market penetration on a world map to effectively communicate international business strategy. Demonstrates global footprint to investors, partners, and stakeholders in a single, impactful visual.
-
How to Use
Highlight target countries on the world map using color coding, then explain each color's meaning in the legend section. Add market size, entry timeline, or business details in the text areas to customize for your presentation context. Suitable for business pitches, annual reports, and strategic planning meetings.
-
Recommended For
Ideal for multinational company investor relations, international marketing plans, overseas expansion strategy presentations, and global project status reports. Supports data-driven decision-making in executive meetings, investor conferences, and cross-border partnership discussions.
-
Slide Structure
Two-slide set with title area, dual-item legend, world map visualization zone, and customizable text boxes on each slide. Offered in two color schemes—blue accents on beige and orange accents on dark—allowing alignment with corporate branding or presentation theme.
Related Products
-

Customer Reviews PowerPoint Slide – Photo Grid Speech Bubble
#Customer Success Stories #Text Box #Customer Testimonials and Feedback
-

Project Overview PowerPoint Slide – 4-Spec Dark Real Estate
#Product/Service Introduction #Business Strategy #Diagram
-

Business Outcome PowerPoint Slide – 3-Circle Solution Hub
#Company Introduction #Business Strategy #Diagram
-

Company Capabilities PowerPoint Slide – 3-Circle Icon Layout
#Company Introduction #Product/Service Introduction #Business Vision and Strategy
