Travel Survey Results – Market Share Visualization
RB0600005-1_4
- Last Update 03/14/2025
- File Size 0.7MB
- # of Slides 2
- File Format PPTX
- Slide Ratio 4:3
- Color
Keywords
About the Product
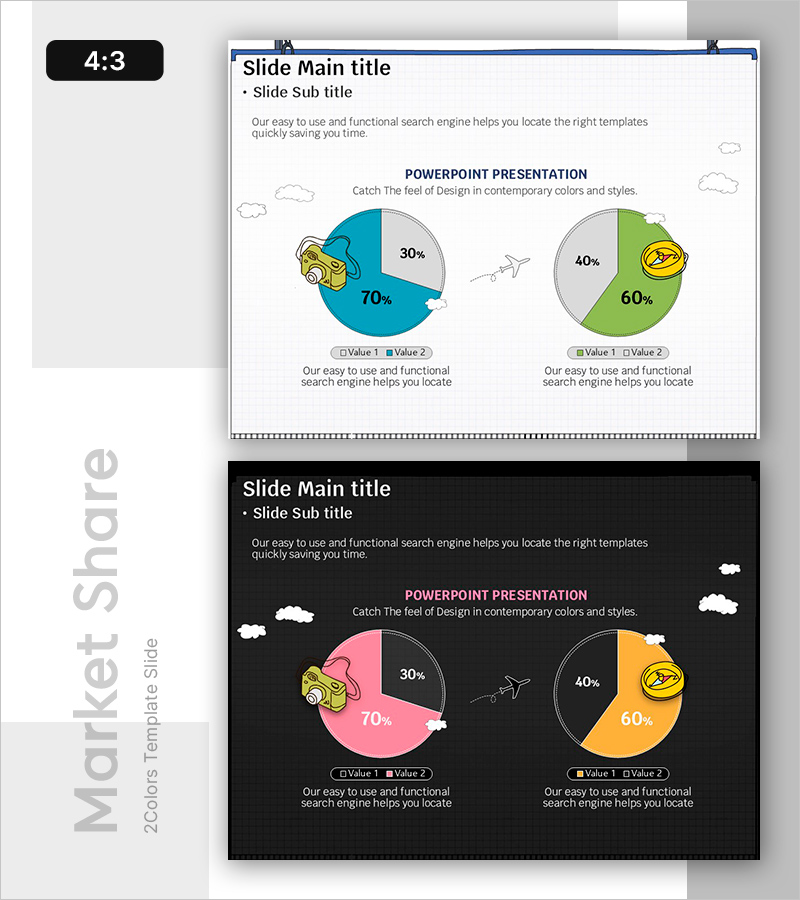
A 2-slide PowerPoint presentation featuring pie charts to visualize travel survey results and market share data. The slides display two separate pie charts in teal and lime green colors, each divided into two segments with percentage values and legends. Travel-themed illustrations including airplane, camera, and cloud icons enhance the visual appeal. Formatted in 4:3 aspect ratio PPTX, fully editable for immediate use in market analysis, survey presentations, and travel industry reports.
Usage Points
-
Main Usage
Communicate travel survey findings and market share percentages through intuitive pie chart visualization. Each chart represents independent data series with clear percentage labels and legends, enabling audiences to quickly grasp proportional relationships in your travel or tourism data.
-
How to Use
Slide 1 features a teal pie chart (70% vs 30%), Slide 2 displays a lime green pie chart (60% vs 40%). Add descriptive text below each chart to explain survey context or conclusions. Replace percentage values and labels with your actual survey data. Customize colors and text as needed.
-
Recommended For
Travel agencies, tourism boards, airlines, hotel chains, market research firms, and marketing teams presenting survey results. Ideal for visualizing consumer preferences, destination popularity, booking channel distribution, and other travel-related data analysis in professional presentations.
-
Slide Structure
2-slide layout. Each slide contains 1 pie chart (2-segment division), legend (Value 1, Value 2), percentage values, travel-themed illustrations (airplane, camera, cloud), and descriptive text area. 4:3 aspect ratio, PPTX format with fully editable colors, numbers, and text fields.
Related Products
-

Pie Chart for Oriental Medicines Market Overview
#Market and Competitor Analysis #Graph #Market Status
-

City and Nature Pie Chart Statistics – Visualization of Market Status
#Market and Competitor Analysis #Graph #Market Status
-

Triangle Pattern PPT Template for Visualizing Market Share with Pie Charts
#Market and Competitor Analysis #Graph #Market Status
-

Yellow Marketing Pie Chart – Market Share Analysis
#Market and Competitor Analysis #Graph #Market Status
