Rising Section Blue Line Chart - Sales and Revenue Analysis
RB0800002_14
- Last Update 03/17/2025
- File Size 0.1MB
- # of Slides 2
- File Format PPTX
- Slide Ratio 4:3
- Color
Keywords
- #Content-Based Slides
- #Design-Based Slides
- #Market and Competitor Analysis
- #Financial Plans and Performance
- #Graph
- #Competitive Advantage
- #Sales and Revenue
- #Line
- #Line Chart
- #4:3
- #line chart PowerPoint
- #2-series line graph slide
- #sales analysis presentation
- #financial performance chart
- #revenue trend visualization
- #data visualization PowerPoint template
About the Product
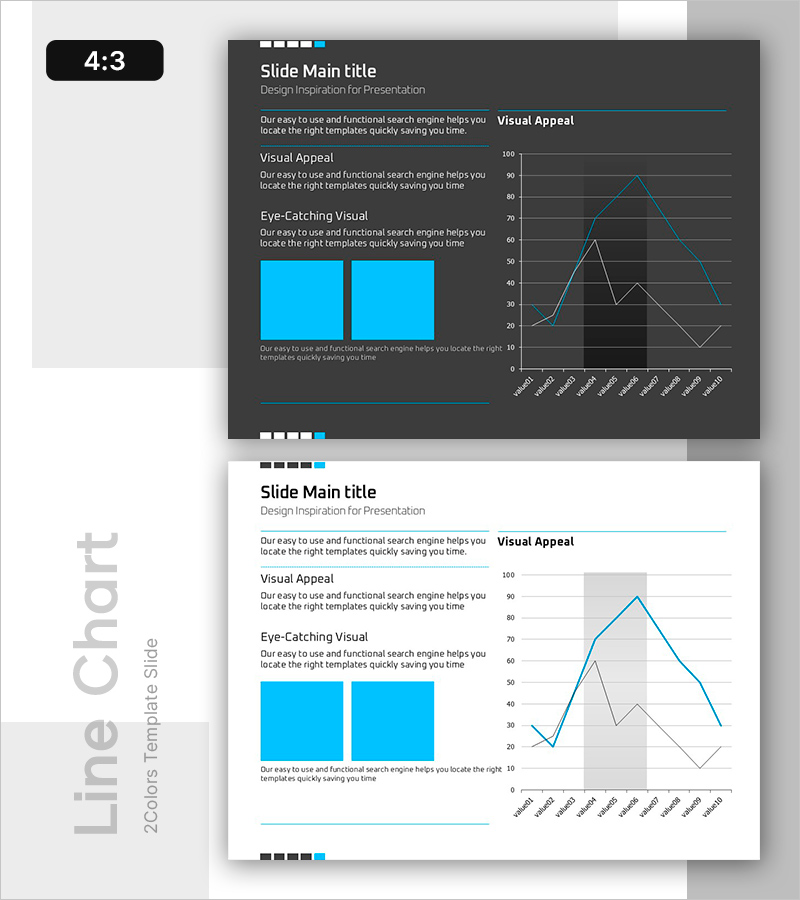
A 2-series line chart PowerPoint slide designed for sales and revenue analysis. The dark background with bright blue accent lines emphasizes upward trends, while the balanced layout combines a left text area with a right chart area. The horizontal axis displays monthly data points (January to October) and the vertical axis shows a numerical range (0–100), making it immediately applicable for financial performance comparison and market analysis. The 2-slide set includes both dark and light themes to match your presentation environment.
Usage Points
-
Main Usage
Visualize monthly sales and revenue progression, compare performance metrics, and track market share changes using two data series to clearly communicate upward trends and achievement levels across time periods.
-
How to Use
Enter analysis title, description, and key insights in the left text area, then edit the chart data points and line colors to match your actual figures. Customize the horizontal axis labels for monthly, quarterly, or annual data analysis as needed.
-
Recommended For
Finance teams presenting quarterly or annual performance reports, sales teams showcasing revenue achievements, executive dashboards highlighting key metrics, investor presentations demonstrating growth rates, and marketing teams analyzing campaign effectiveness.
-
Slide Structure
2-slide set with dark theme (dark gray background with bright blue and white lines) and light theme (white background with blue lines). Each slide features a 40% left text area and 60% right chart area, with the chart containing 2 data series, 10 data points, and gridlines for reference.
Related Products
-

Product-wise Vertical Bar Chart and Analysis - Market and Competitive Analysis
#Market and Competitor Analysis #Financial Plans and Performance #Graph
-

Graph Analysis by Year Sales
#Market and Competitor Analysis #Financial Plans and Performance #Graph
-

Competitor Market Analysis Graph – Financial Performance and Competitive Advantage
#Market and Competitor Analysis #Financial Plans and Performance #Diagram
-

Sales and Net Income Graph – Visualizing Business Performance
#Market and Competitor Analysis #Financial Plans and Performance #Graph
