Visualization of Korea's Target Area – Practical Network Diagram
RB0800001_5
- Last Update 03/17/2025
- File Size 0.6MB
- # of Slides 2
- File Format PPTX
- Slide Ratio 4:3
- Color
Keywords
About the Product
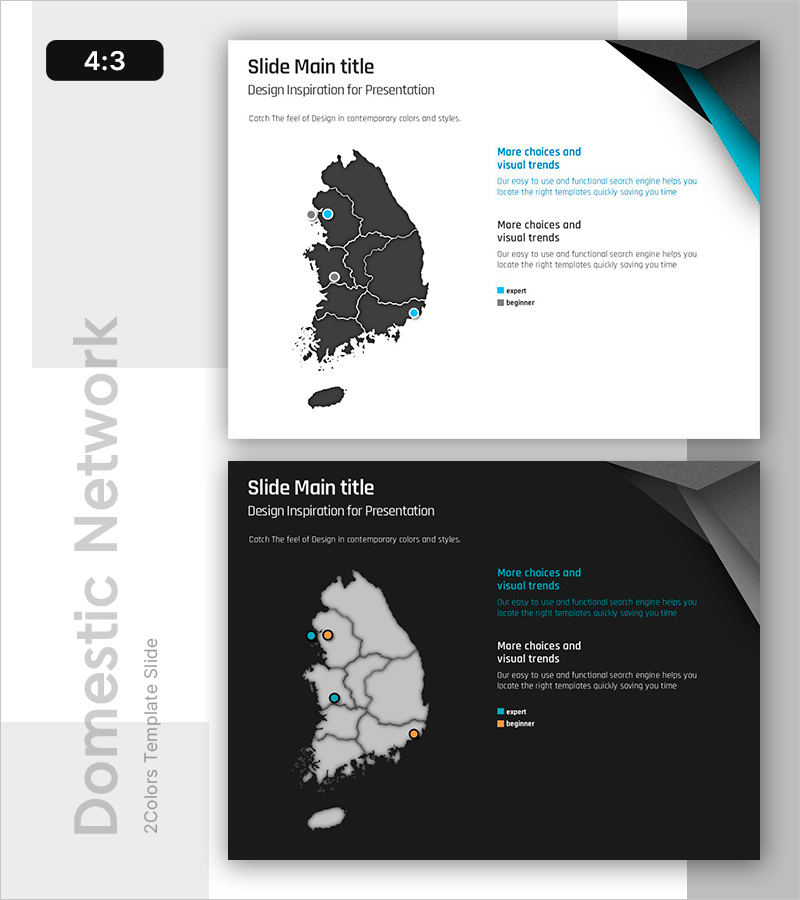
A 2-slide PowerPoint presentation designed for visualizing regional target analysis across South Korea. Provided in both dark and light background versions, this slide deck features clearly defined regional boundaries with circular markers and color-coded points highlighting key business hubs. The right-side text area accommodates detailed descriptions of regional characteristics, market conditions, and expansion strategies. Created in 4:3 aspect ratio for seamless compatibility with existing presentations, these slides are fully editable and ready for immediate use in business reports, market analysis, and regional strategy presentations.
Usage Points
-
Main Usage
Use this slide when presenting domestic market entry strategies, regional marketing plans, or sales hub analysis. The map boundaries and hub markers provide instant visual clarity on target market locations and coverage areas, while the right-side text section supports detailed regional insights, market size data, and expansion timelines for persuasive presentations.
-
How to Use
Enter region names, market conditions, and strategic details in the right-side text input areas. The circular markers and color-coded points on the map emphasize key business hubs and can be customized by adding additional hubs or adjusting colors as needed. Select the dark background version for professional corporate settings or the light background for approachable, friendly presentations.
-
Recommended For
Ideal for executives developing region-based business strategies, marketing managers planning domestic market expansion, sales leaders reporting on hub expansion, consultants presenting regional market analysis, and startup founders pitching domestic business plans to investors.
-
Slide Structure
Two-slide layout with one dark-background slide and one light-background slide. Each slide features a left-side Korea map with regional boundaries, hub markers, and color-coded points, paired with a right-side section containing title, subtitle, and two text description areas. A legend (expert/beginner) clarifies the meaning of each hub marker type.
Related Products
-

Map of Domestic Networks and Partners in the U.S. – Orange, Green, Purple
#Company Introduction #Other #Customers and Partners
-

Aurora Analysis by US Region – Visualization for Insights
#Company Introduction #Market and Competitor Analysis #Other
-

Map of Korea Showing Locations by Region – Overview of Our Domestic Network
#Company Introduction #Other #Domestic Network
-

Market Analysis with Map Infographic Illustration – Strategies for Business Success
#Company Introduction #Market and Competitor Analysis #Other
