Domestic Network and Target Europe Map – Strategic Expansion
RJ0400021_26
- Last Update 05/23/2025
- File Size 1.9MB
- # of Slides 2
- File Format PPTX
- Slide Ratio 16:9
- Color
Keywords
About the Product
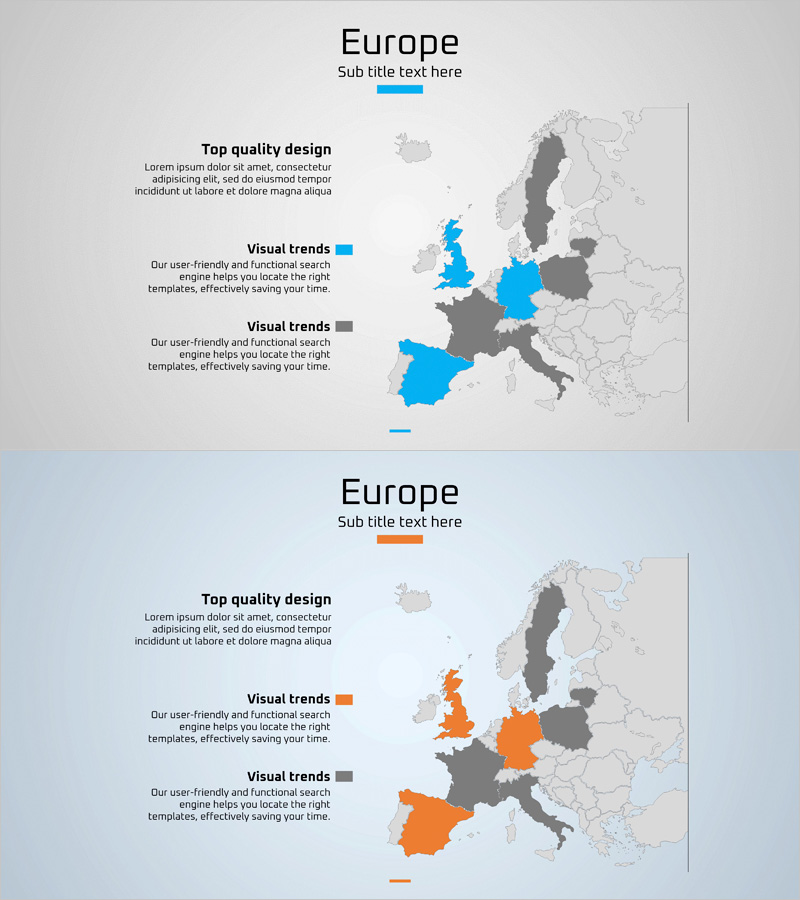
A geographic PowerPoint slide set designed to visualize domestic network expansion and European market entry strategies. The template features a gray-background Europe map with countries highlighted in blue and orange to represent different market statuses or expansion phases. The left side includes three text boxes for strategic descriptions, analysis, and implementation plans. The two-slide composition offers contrasting color schemes (blue/gray and orange/gray) to illustrate comparative analysis or phased expansion roadmaps. Delivered in 16:9 widescreen PPTX format for immediate editing, this template is ideal for investor presentations, executive briefings, international business strategy meetings, and market expansion reports.
Usage Points
-
Main Usage
Visualize corporate expansion into European markets, illustrate global network growth, and communicate regional business status through geographic mapping to executives, investors, and business partners with clear, data-driven visuals.
-
How to Use
Enter regional strategies, targets, and performance metrics in the left text boxes. Edit map colors to distinguish market status (blue for current presence, orange for target markets, gray for untapped regions). Use both slides sequentially to show Before-After scenarios or phased expansion timelines.
-
Recommended For
C-suite executives planning international expansion, global business development managers, investor relations professionals, international marketing teams, and management consultants presenting regional market analysis and strategic growth initiatives.
-
Slide Structure
Each slide contains a title area (top center), three left-aligned text boxes for descriptions and strategic insights, and a right-side Europe map with country-level color-coding capability. A legend (Visual trends) clarifies color meanings for audience comprehension.
Related Products
-

Traffic Accident Ratio Infographic by Region – Data Visualization
#Company Introduction #Market and Competitor Analysis #Other
-

South Korea Target Area Infrastructure Map – Market and Competitor Analysis
#Company Introduction #Market and Competitor Analysis #Other
-

Domestic Network Europe Map Slide – Effective Market Analysis
#Company Introduction #Market and Competitor Analysis #Other
-

Key Regional Hubs Visualization – Showcasing Enhanced Connectivity
#Company Introduction #Market and Competitor Analysis #Diagram
