Aurora Analysis by US Region – Visualization for Insights
RJ0600032_6
- Last Update 06/29/2025
- File Size 0.9MB
- # of Slides 2
- File Format PPTX
- Slide Ratio 16:9
- Color
Keywords
About the Product
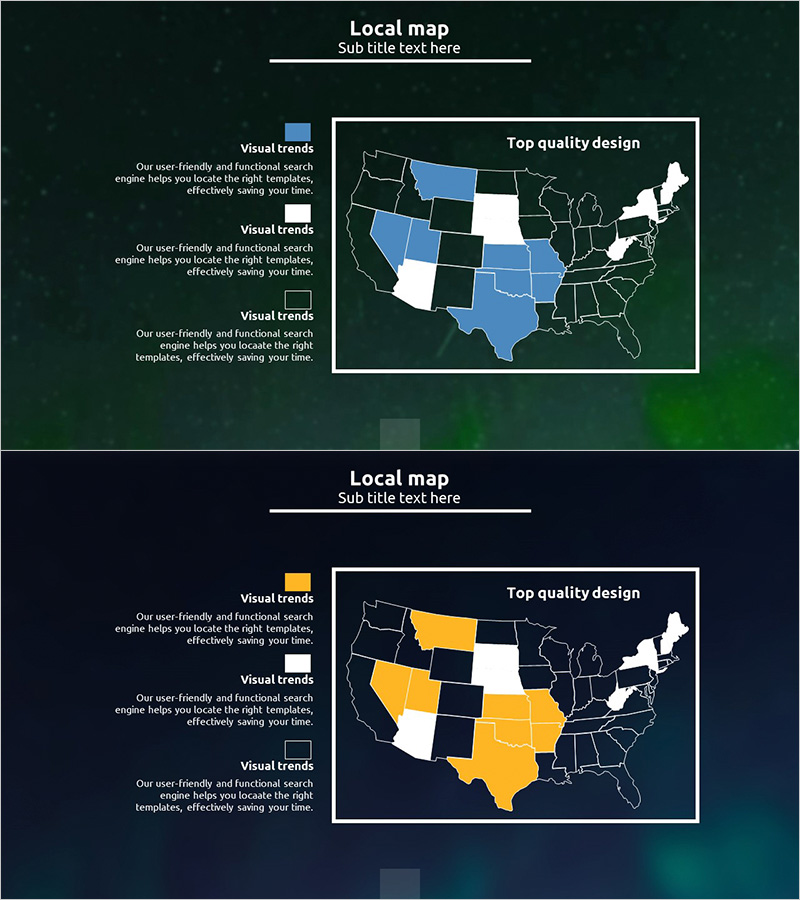
A 2-slide set featuring US regional maps for data visualization and geographic analysis. Set against a dark green background with blue, white, and yellow color-coded states, these slides enable clear regional comparison and insight presentation. Ideal for market analysis, regional performance reports, and sales dashboards in business presentations. The 16:9 widescreen format integrates seamlessly into modern PowerPoint decks, allowing you to highlight regional categories, metrics, and performance at a glance through intuitive color differentiation.
Usage Points
-
Main Usage
Visualize regional data, performance metrics, and market share using geographic mapping to support data-driven decision-making. Ideal for sales performance, market expansion strategy, and customer distribution analysis across US regions.
-
How to Use
Modify state colors to match your data values and populate the left-side text areas with analysis findings and key insights. Establish a clear color legend to ensure audience comprehension of regional comparisons and trends.
-
Recommended For
Marketing plans, business reports, investor pitch decks, market analysis presentations, sales performance reviews, regional expansion strategies, and any business presentation requiring geographic data comparison and regional insights.
-
Slide Structure
2-slide layout: Slide 1 features blue-toned regional map with 3 text input boxes on the left; Slide 2 displays mixed yellow and blue regional map with 3 text input boxes. Each slide includes clearly defined title, legend, and data entry areas for seamless customization.
Related Products
-

Market Analysis with Map Infographic Illustration – Strategies for Business Success
#Company Introduction #Market and Competitor Analysis #Other
-

Forest Illustration Global Map – Visualizing Market Analysis
#Company Introduction #Market and Competitor Analysis #Other
-

Progress Donut Chart – Visual Aid for Market Analysis
#Market and Competitor Analysis #Graph #Other
-

Market Development Status PowerPoint Slide – Sustainability and Growth
#Product/Service Introduction #Market and Competitor Analysis #Other
