Radar Chart Slide Visualizing Crime Data
RJ0800010_5
- Last Update 08/02/2025
- File Size 0.6MB
- # of Slides 2
- File Format PPTX
- Slide Ratio 16:9
- Color
Keywords
- #Content-Based Slides
- #Design-Based Slides
- #Product/Service Introduction
- #Business Vision and Strategy
- #Graph
- #Features
- #Core Competencies
- #Other
- #Radar Chart Spider Chart
- #16:9
- #radar chart PowerPoint
- #radial diagram slide template
- #5-axis comparison chart
- #multi-variable data visualization
- #how to create radar chart in PowerPoint
About the Product
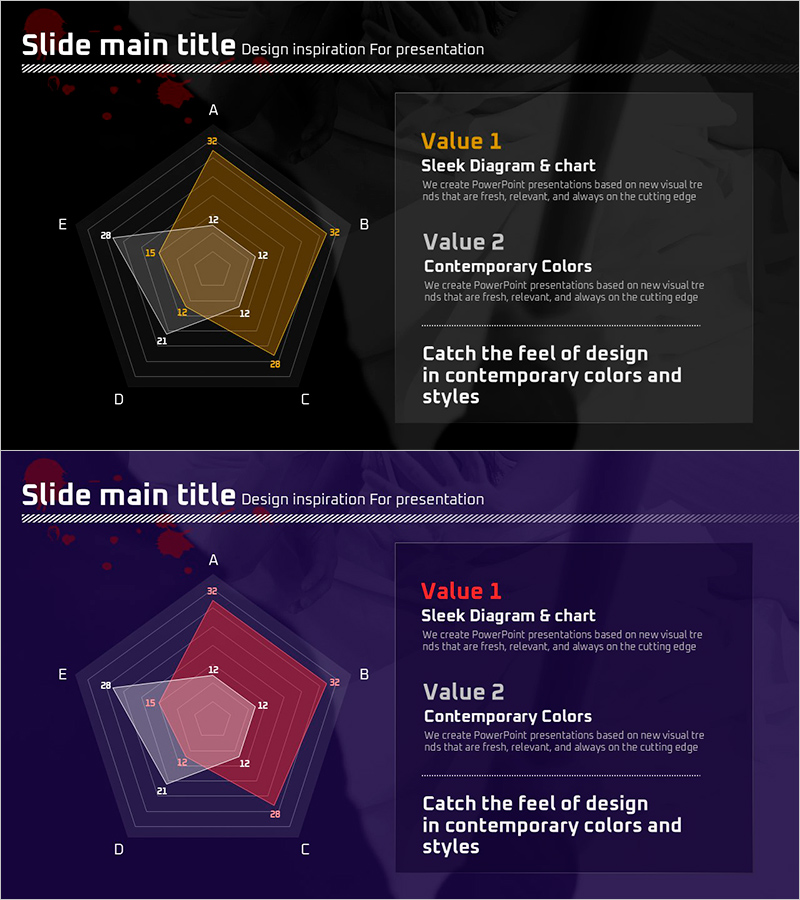
A radial radar chart PowerPoint slide comparing five variables across multiple dimensions with gold and red gradient fills on a dark background. This multi-axis visualization effectively displays data relationships and performance gaps, making it ideal for crime statistics, capability assessments, competitive analysis, and performance evaluations. The 2-slide set allows you to present multiple datasets with consistent design. Each axis is clearly labeled with numeric values, and accompanying text boxes provide space for insights and analysis interpretation.
Usage Points
-
Main Usage
Display and compare five or more variables simultaneously using a radial axis system. This chart type excels at showing performance profiles, capability matrices, and competitive positioning where multiple metrics need to be evaluated against each other. The overlapping polygons make it easy to identify strengths, weaknesses, and comparative advantages at a glance.
-
How to Use
Replace the numeric labels (32, 12, 15, 21, 28) with your actual data values. Update the legend text (Value 1, Value 2) to reflect your dataset categories. Modify the right-side text boxes to include your analysis findings and key takeaways. Adjust colors to match your presentation theme or corporate branding guidelines.
-
Recommended For
Data analysts, business consultants, marketing professionals, academic researchers, and executives presenting performance metrics. Suitable for crime data analysis, market research reports, employee capability assessments, competitive benchmarking, product feature comparisons, and strategic planning presentations.
-
Slide Structure
Regular pentagon-shaped radial chart with five axes extending from center to outer vertices. Two data series are overlaid using gold fill and red outline for comparison. Right panel contains two labeled value sections (Value 1, Value 2) with descriptive text and a main message area for analysis summary.
Related Products
-

Competency Radar Chart – Business Vision and Strategy Introduction
#Product/Service Introduction #Business Vision and Strategy #Graph
-

Core Competency Introduction Slide – Harmony of Design and Strategy
#Product/Service Introduction #Business Vision and Strategy #Diagram
-

Analysis Before and After Diet – Change and Achievement
#Product/Service Introduction #Market and Competitor Analysis #Graph
-

Effects and Benefits of Functional Cosmetics – Emphasizing Design
#Product/Service Introduction #Graph #Features
