Sleek Visual Presentation Template – Impactful Data Presentation
RB0700021_5
- Last Update 03/16/2025
- File Size 0.9MB
- # of Slides 2
- File Format PPTX
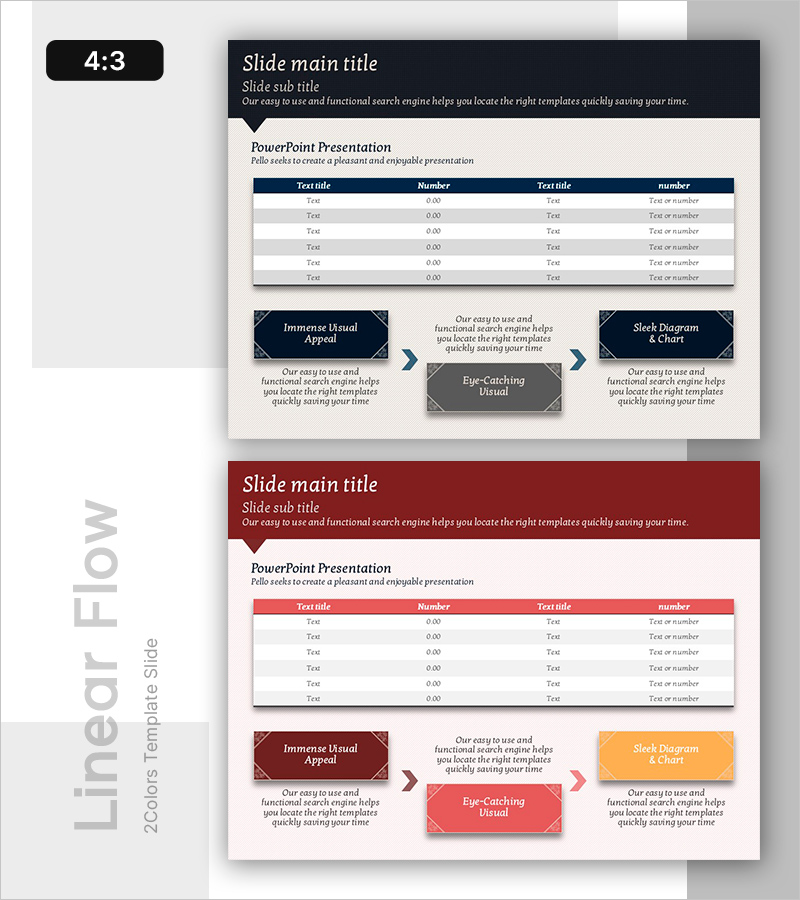
- Slide Ratio 4:3
- Color
Keywords
About the Product
A professional data table slide designed to organize and compare information clearly in your presentation. Features a navy header row and red accent color to visually emphasize data importance, fully editable in PowerPoint format. The 2-slide set adapts to various presentation scenarios, effectively communicating numerical and text data for business reports, proposals, and performance presentations.
Usage Points
-
Main Usage
Used in reports, proposals, and business plans to display numerical data, item comparisons, and performance metrics clearly. The navy header background combined with alternating white and gray data rows enhances readability, while red accent color highlights key figures.
-
How to Use
Double-click table cells in PowerPoint to enter text and numbers directly. Add rows or columns via right-click menu options. Customize colors and fonts through the Design tab. Duplicate the 2-slide set to arrange multiple tables across your presentation.
-
Recommended For
Recommended for executives, marketers, and analysts presenting financial analysis, performance reports, and market research findings. Ideal for all business presentations requiring organized quantitative data such as quarterly results, product comparisons, and customer satisfaction surveys.
-
Slide Structure
Slide 1: Navy header (4 columns) + 6 data rows (alternating white and gray). Slide 2: Red header (4 columns) + 6 data rows. Each cell accepts text and numbers; arrow icons indicate flow direction.
Related Products
-

Yellow Highlight Standard Table – Financial Performance Visualization
#Financial Plans and Performance #Diagram #Capital Requirements
-

Financial Plan Slide – Harmony of Teal and Yellow
#Financial Plans and Performance #Diagram #Capital Requirements
-

Diagram Slide for Funding Plans and Sales Statements
#Financial Plans and Performance #Diagram #Capital Requirements
-

Diagram for Visualizing Financial Plans – Grey Brown Design
#Financial Plans and Performance #Diagram #Capital Requirements
