Diagram Slide for Funding Plans and Sales Statements
RJ0900017_18
- Last Update 08/20/2025
- File Size 0.5MB
- # of Slides 2
- File Format PPTX
- Slide Ratio 16:9
- Color
Keywords
- #Content-Based Slides
- #Design-Based Slides
- #Financial Plans and Performance
- #Diagram
- #Capital Requirements
- #Sales and Revenue
- #Table
- #Standard Table
- #16:9
- #financial data table PowerPoint
- #budget planning slide template
- #sales statement diagram
- #numerical data table PPT
- #financial planning presentation
- #table-based slide design
About the Product
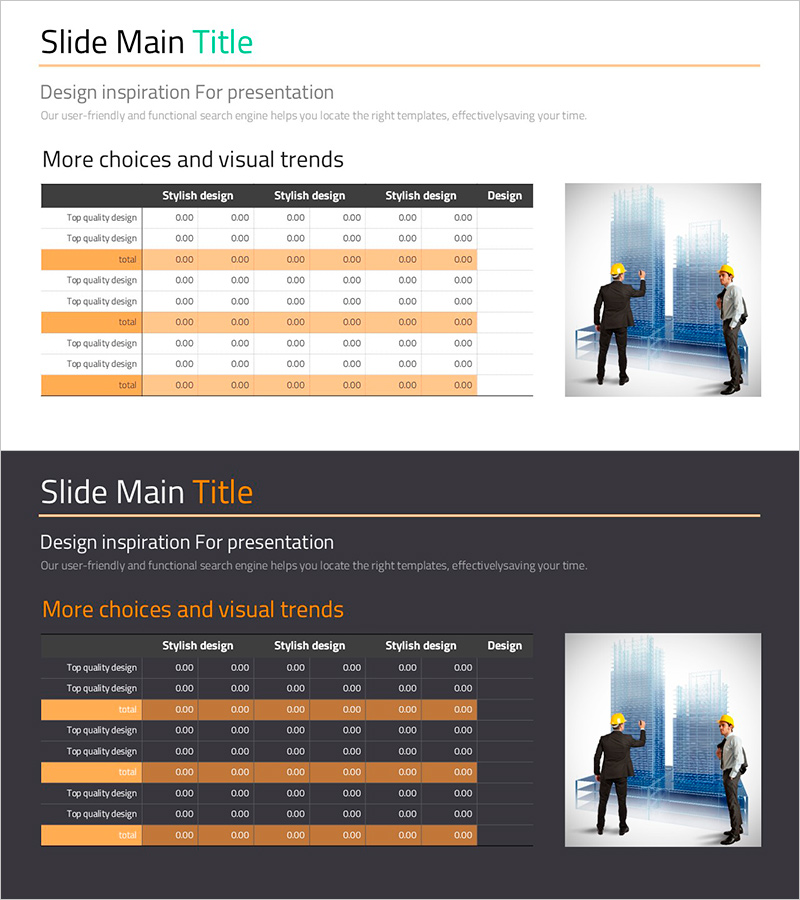
A table-based PowerPoint slide that clearly visualizes funding plans and sales statements with structured data presentation. The slide features a 6-column table layout with a black header row and orange accent rows for emphasis, enabling systematic organization of numerical data. This 2-slide set in 16:9 widescreen format is designed for presenting financial information such as capital requirements, revenue status, and profit structure. Each row is configured for easy data entry and can be immediately applied to business plans, investment proposals, and financial reports as presentation materials.
Usage Points
-
Main Usage
Used in business plans, investment pitches, and financial reports to present numerical data such as capital requirements, revenue status, and profit structure in table format. The black header and orange accent rows visually distinguish important items and focus audience attention on key figures.
-
How to Use
Enter item names (capital requirements, operating costs, marketing expenses, etc.) in each row and input monthly, quarterly, or annual figures in the columns. Use orange accent rows for subtotals or total amounts to highlight critical data. Colors and layout can be adjusted to match existing slide designs.
-
Recommended For
CFOs, financial managers, business planners, and startup founders explaining funding plans and financial status to investors or executives. Suitable for bank loan applications, venture capital fundraising, internal financial meetings, and other situations requiring quantitative data-driven decision-making.
-
Slide Structure
Consists of 2 slides, each featuring a 6-column table structure. The first column contains item names, while the remaining 5 columns serve as data entry areas. The header row has a black background with white text, data rows have a white background, and accent rows (subtotals/totals) feature an orange background to create visual hierarchy.
Related Products
-

Estimated Income Report Analysis Table – Financial Planning and Performance
#Financial Plans and Performance #Diagram #Capital Requirements
-

Fund Planning and Revenue Tables – Financial Performance Analysis
#Financial Plans and Performance #Diagram #Other
-

Infinite Energy Wide PPT Table Analysis – Core of Financial Planning
#Financial Plans and Performance #Diagram #Capital Requirements
-

Retirement Budget Planning Table – The First Step to Financial Stability
#Financial Plans and Performance #Diagram #Capital Requirements
