Cluster Diagram Visualizing Main Food Ingredient Composition
RB0700013-1_12
- Last Update 03/16/2025
- File Size 2.2MB
- # of Slides 2
- File Format PPTX
- Slide Ratio 4:3
- Color
Keywords
- #Content-Based Slides
- #Design-Based Slides
- #Product/Service Introduction
- #Diagram
- #Product/Service Introduction
- #Features
- #Cluster
- #Closed Cluster Diagram
- #4:3
- #cluster diagram PowerPoint
- #food ingredient composition slide
- #product classification diagram
- #food introduction slide template
- #category visualization PPT
About the Product
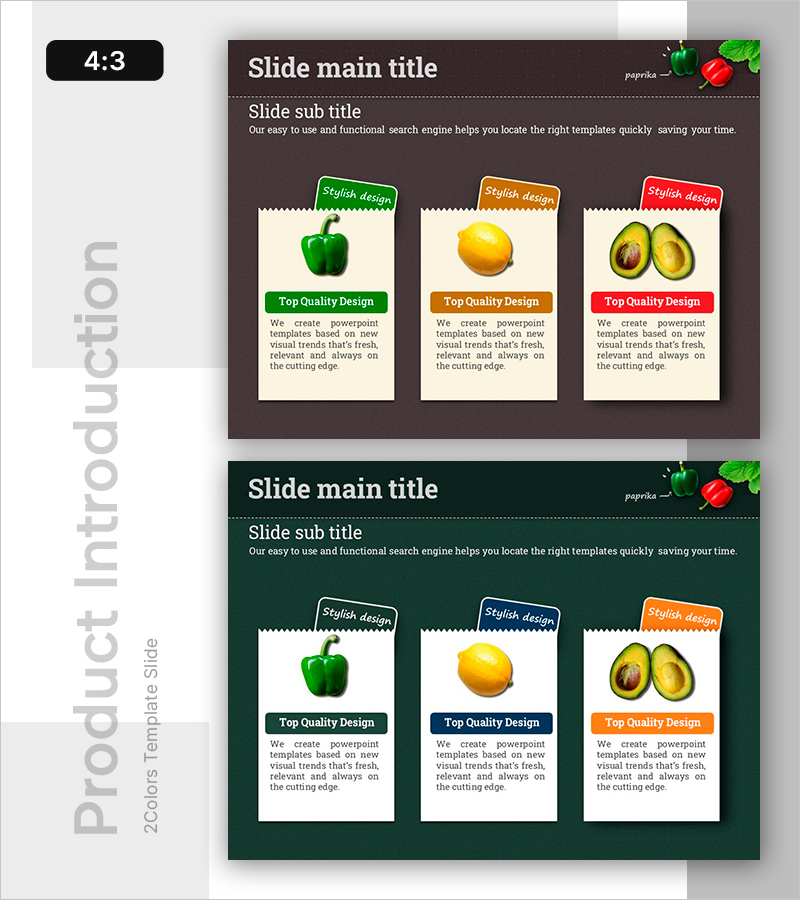
A closed-form cluster diagram PowerPoint slide that visualizes main food ingredient composition across three distinct categories. Color-coded in green, orange, and red to differentiate ingredient groups, with card-style layouts featuring product images and descriptive text for enhanced information delivery. Ready-to-use for food company product presentations, nutritional component explanations, and raw material composition pitches.
Usage Points
-
Main Usage
Classifies and compares main ingredients or raw materials of food and beverage products across three categories for clear visual explanation. The closed-form structure emphasizes group independence while presenting overall composition coherently.
-
How to Use
Insert into the 'Raw Material Composition' or 'Nutritional Components' section of product presentation slides. Replace card images and text with actual ingredient information, using color coding to highlight category-specific characteristics.
-
Recommended For
Food and beverage company product presentations, nutritionist and food expert educational seminars, marketing proposal product composition sections, ingredient supplier business pitches.
-
Slide Structure
2-slide set in 4:3 aspect ratio. Each slide features three closed-form cluster nodes (green, orange, red) centered on the slide, with product images, 'Top Quality Design' labels, and descriptive text arranged in card format below each node.
Related Products
-

Interior Service Overview Presentation Template - Innovation and Trust
#Product/Service Introduction #Diagram #Product/Service Introduction
-

Diagram Slide Presentation of World Travel Destinations Photos and Features
#Product/Service Introduction #Diagram #Product/Service Introduction
-

Introduction to Healthcare Business Services – Utilizing Cluster Diagram
#Product/Service Introduction #Diagram #Product/Service Introduction
-

Diagram Slide Explaining Structure and Function of Plants
#Product/Service Introduction #Diagram #Product/Service Introduction
