Tree PPT Year-by-Year Table – Market and Competitor Analysis
RB0700011_5
- Last Update 03/15/2025
- File Size 1.6MB
- # of Slides 2
- File Format PPTX
- Slide Ratio 4:3
- Color
Keywords
- #Content-Based Slides
- #Design-Based Slides
- #Product/Service Introduction
- #Market and Competitor Analysis
- #Diagram
- #Composition
- #Market Analysis
- #Table
- #Standard Table
- #4:3
- #year-by-year table PowerPoint
- #data comparison slide template
- #market analysis table
- #annual data comparison
- #table slide design
About the Product
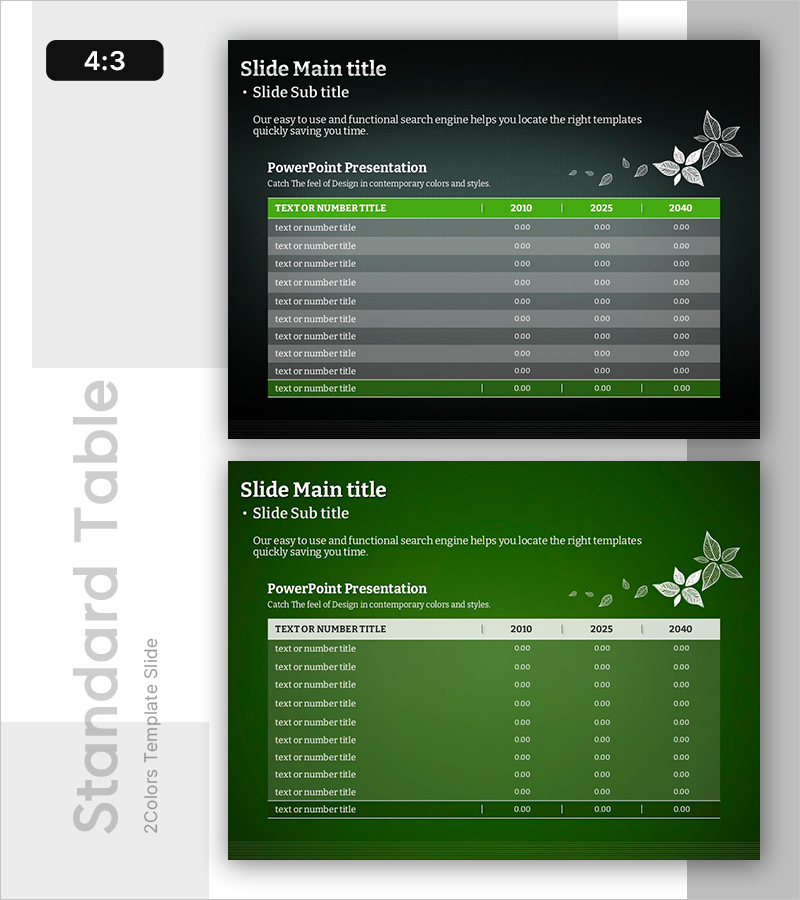
A year-by-year data table PowerPoint slide optimized for market analysis and competitor comparison. This horizontal table structure enables side-by-side comparison of numerical data across three years (2010, 2025, 2040), organizing 10 data items systematically. The green header and gray rows create clear visual distinction, enhancing data readability for presentations and reports. The 4:3 aspect ratio with 2-slide layout adapts to various presentation environments. Perfect for business plans, investor pitches, and strategic analysis documents requiring temporal data visualization.
Usage Points
-
Main Usage
Systematically compare and analyze year-by-year numerical data across multiple periods. Visualize market size trends, competitor performance metrics, financial indicator changes, and other temporal data patterns. The green header and gray row color scheme provides intuitive visual hierarchy for data comprehension.
-
How to Use
Deploy in business plans, investor presentations, and market analysis reports within data sections. Input year-by-year performance metrics, market share evolution, competitive landscape analysis, and financial comparisons into the table cells. Ready for immediate use in presentations after data entry.
-
Recommended For
Executives, planning teams, marketing departments, and finance teams making data-driven decisions. Particularly suited for business performance reports, strategic planning presentations, investor pitch decks, academic presentations, and consulting proposals requiring temporal analysis.
-
Slide Structure
Two-slide set with identical table layout. Each slide features a header row (green background, white text) and 10 data rows (gray background, black text) with 3 year columns (2010, 2025, 2040) for numerical input. 4:3 aspect ratio ensures all data displays clearly and legibly.
Related Products
-

Game Data Analysis Table – Market Analysis and Trends
#Product/Service Introduction #Market and Competitor Analysis #Diagram
-

Market Analysis Segmented Bar Graph & Table Chart – Visualization of Competitive Analysis
#Market and Competitor Analysis #Diagram #Graph
-

Green Yellow Data Analysis Chart – Market and Competitive Analysis
#Business Introduction #Market and Competitor Analysis #Diagram
-

Mint Yellow Table Slide – An Efficient Tool for Business Management
#Product/Service Introduction #Business Management #Diagram
