Sugar Content by Fruit – Revenue Performance Analysis
RJ0800002_12
- Last Update 07/31/2025
- File Size 0.3MB
- # of Slides 2
- File Format PPTX
- Slide Ratio 16:9
- Color
Keywords
- #Content-Based Slides
- #Design-Based Slides
- #Product/Service Introduction
- #Financial Plans and Performance
- #Diagram
- #Composition
- #Sales and Revenue
- #Table
- #Standard Table
- #16:9
- #table PowerPoint slide
- #horizontal table template
- #data comparison slide
- #3-column table design
- #financial analysis PowerPoint
- #performance comparison slide
About the Product
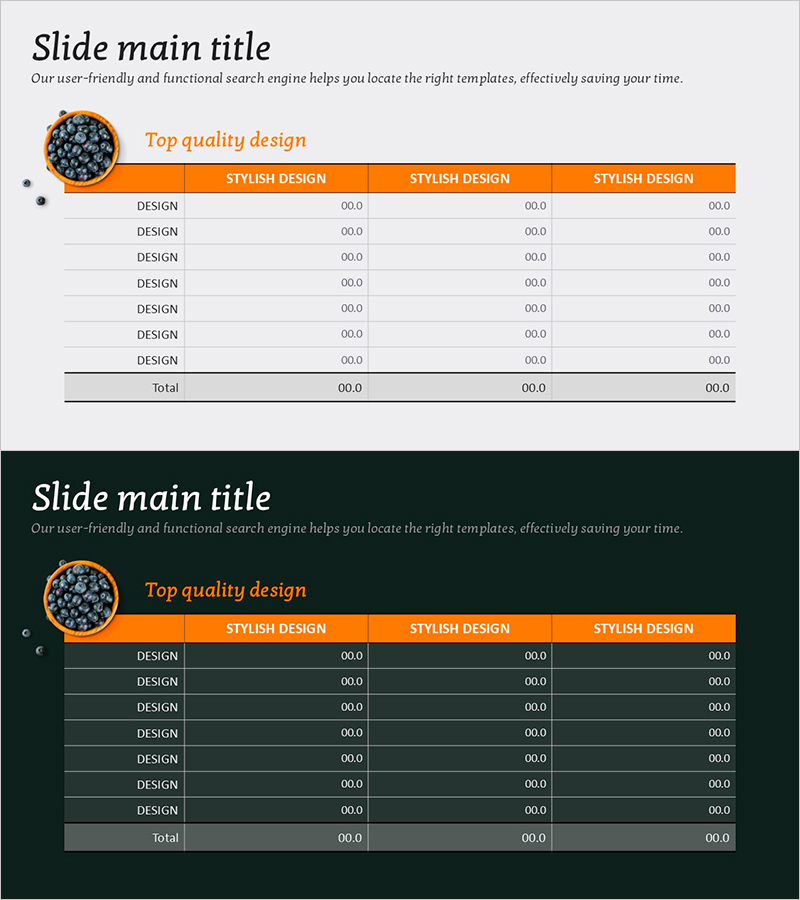
A horizontal table PowerPoint slide with three columns and orange header design. The layout features alternating white and gray rows for clear data organization, with a circular image element on the left side as a visual anchor. This slide template is ready to use for financial analysis, performance comparisons, and item-by-item data presentations. The 2-slide set includes both light and dark background versions, allowing you to match your presentation's tone and lighting conditions.
Usage Points
-
Main Usage
Presents numerical data, comparative information, and performance metrics in a structured table format. Ideal for financial reports, sales performance, departmental results, product specifications, and any quantitative data that requires clear side-by-side comparison.
-
How to Use
Simply replace the header text and cell data with your own content. Use the light background slide for standard presentations and the dark background version for evening events or sophisticated corporate settings. You can further customize row colors to highlight key items or totals.
-
Recommended For
Finance teams presenting quarterly results, sales teams comparing revenue figures, product development teams showcasing specifications, executive reports, and consulting proposals. Especially valuable for data-driven decision meetings and stakeholder briefings.
-
Slide Structure
2-slide set with identical layouts. Each slide features a left circular image area (approximately 80px) and a right-aligned 3-column table. The table structure includes an orange header row, 7 data rows, and 1 total row (9 rows total). All cells support text editing, with alternating white and gray backgrounds for enhanced readability.
Related Products
-

Visualizing Business Strategies with Tables & Charts – Clear Data Presentation
#Business Strategy #Financial Plans and Performance #Diagram
-

Sales and Profit Chart by Year – Effective Financial Analysis
#Market and Competitor Analysis #Financial Plans and Performance #Diagram
-

Logistics Factor Comparison Table – Intuitive Data Analysis
#Financial Plans and Performance #Diagram #Sales and Revenue
-

Market Analysis Graphs & Tables – Visualizing Sales Growth
#Market and Competitor Analysis #Financial Plans and Performance #Diagram
