Game Data Analysis Table – Market Analysis and Trends
RJ0800026_26
- Last Update 08/07/2025
- File Size 0.6MB
- # of Slides 2
- File Format PPTX
- Slide Ratio 16:9
- Color
Keywords
- #Content-Based Slides
- #Design-Based Slides
- #Product/Service Introduction
- #Market and Competitor Analysis
- #Diagram
- #Composition
- #Market Analysis
- #Table
- #Standard Table
- #16:9
- #game market analysis table PowerPoint
- #competitive analysis slide template
- #data comparison chart PPT
- #game industry analysis presentation
- #market research table download
About the Product
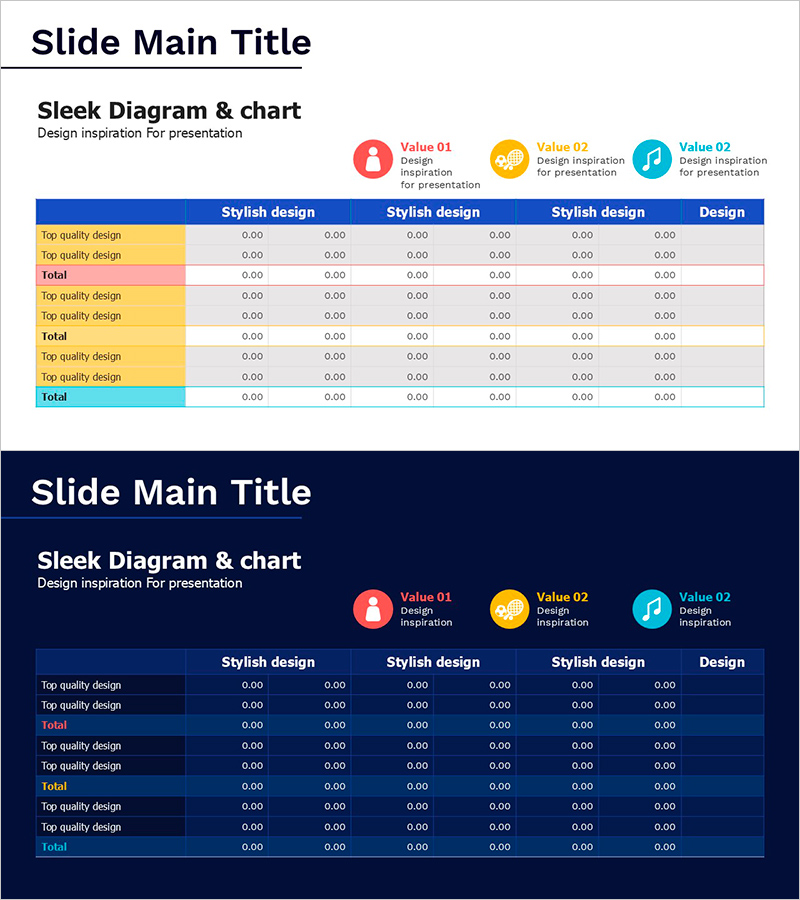
A professional PowerPoint table slide optimized for game industry market analysis and competitive benchmarking. Features a 4-row-group × 6-column data structure with color-coded rows (blue, yellow, pink, cyan) for clear category distinction. Three circular icons at the top highlight key metrics (Value 01, 02, 03), enabling side-by-side comparison of multiple data points. Ideal for game developers, publishers, and marketing teams presenting market reports, strategic planning, and executive briefings. Fully editable and ready for immediate use in presentations.
Usage Points
-
Main Usage
Visualize game industry market size, competitor landscape, and trend analysis data in a structured table format for executives, investors, and team members. Color-coded rows enable intuitive category distinction and strengthen numerical data comparison and strategic insights.
-
How to Use
Insert into business plans, quarterly reports, and strategic presentations for game studios and publishers to explain market positioning and competitive analysis. Maintain row colors while entering data, or add/remove rows and columns as needed to accommodate additional data points.
-
Recommended For
Game company executives, marketing teams, business development managers, and investor relations professionals presenting market analysis results. Suitable for game industry analysis reports, new game launch strategy presentations, competitive benchmarking documents, and quarterly performance reviews.
-
Slide Structure
Title area + 3 circular icon emphasis section + 4 color-coded row groups (blue, yellow, pink, cyan) × 6-column data table. Each row group contains 3–4 sub-items totaling 12 data rows. Two-slide set with light and dark background versions for flexible presentation design.
Related Products
-

Tree PPT Year-by-Year Table – Market and Competitor Analysis
#Product/Service Introduction #Market and Competitor Analysis #Diagram
-

Note Illustration Theme Chart – Market Analysis and Competitor Insights Tool
#Market and Competitor Analysis #Diagram #Graph
-

Sales and Profit Chart by Year – Effective Financial Analysis
#Market and Competitor Analysis #Financial Plans and Performance #Diagram
-

Security Business Composition Pie Chart – Market and Competitor Analysis
#Product/Service Introduction #Market and Competitor Analysis #Graph
