Regional Analysis of Retiree Lifestyle & Environment – Market Status Visualization
RB0700010_7
- Last Update 03/15/2025
- File Size 2.1MB
- # of Slides 2
- File Format PPTX
- Slide Ratio 4:3
- Color
Keywords
About the Product
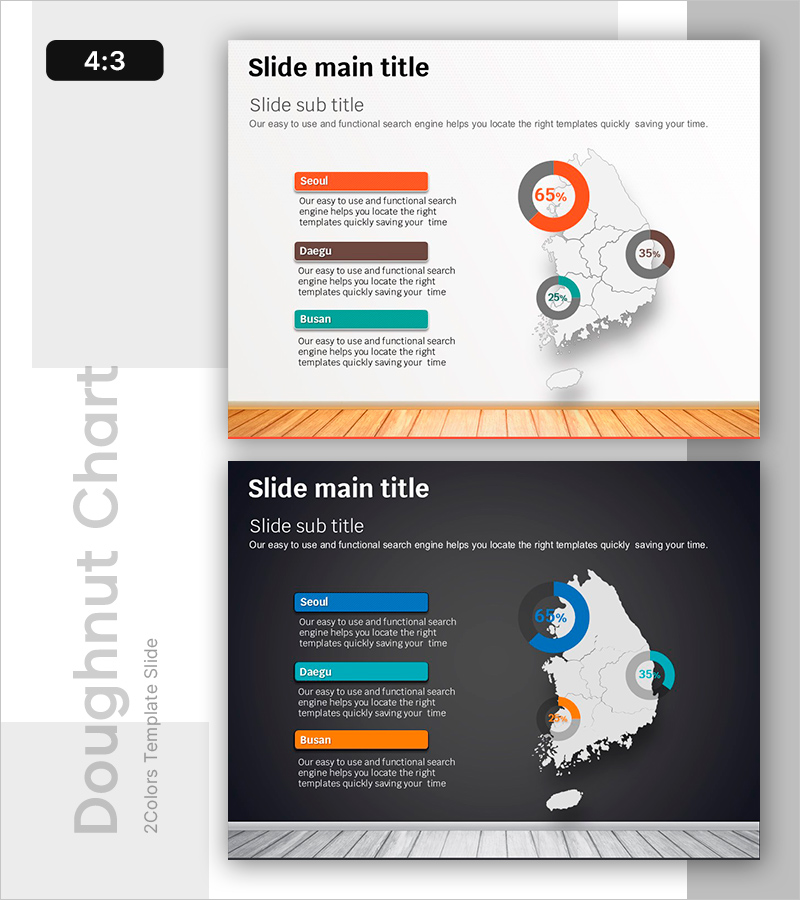
A regional data analysis PowerPoint slide combining a Korea map with donut charts. This presentation template displays three regions (Seoul, Daegu, Busan) with percentage data in donut graph format, accompanied by descriptive text for each region. The light background features three distinct colors—orange, brown, and teal—to differentiate regional donut charts, making statistical comparisons, market share, and population distribution intuitive and visually clear. The 4:3 aspect ratio with 2-slide composition is ready for immediate use in business presentations.
Usage Points
-
Main Usage
This slide is designed for comparing and analyzing regional data through visualization. By combining donut charts with a Korea map, it enables quick comprehension of regional percentages, market share, and distribution patterns. It is optimized for statistical presentations, market status reports, and regional demographic analysis.
-
How to Use
Edit the donut chart values and text labels with your own regional data. Modify region names and description text as needed, and adjust colors to match your organization's branding guidelines. The slide can be directly inserted into regional statistics presentations, business reports, and marketing strategy documents.
-
Recommended For
Ideal for executives, marketing teams, and planning departments in region-based businesses. Suitable for local government and public institutions presenting regional policies, real estate and retail companies reporting regional performance, and academic institutions presenting regional research analysis.
-
Slide Structure
Two-slide composition featuring a Korea map on the right side with three donut charts (showing 65%, 35%, 25% respectively) positioned alongside. The left side contains region labels (Seoul, Daegu, Busan) and descriptive text areas, with a wood-grain design element at the bottom for visual balance.
Related Products
-

Idea Presentation Template Wide – Market Analysis and Visualization
#Market and Competitor Analysis #Graph #Other
-

Origami Presentation Template – Market Insights and Vision Map Analysis
#Market and Competitor Analysis #Graph #Other
-

Global Architectural Donut Chart – Market Share Visualization
#Market and Competitor Analysis #Graph #Other
-

Marking Milestones with Market Data – Market Status and Share
#Market and Competitor Analysis #Graph #Market Status
