Child Traffic Education Implementation Table – Market Analysis and Execution Plan
RB0700006_8
- Last Update 03/15/2025
- File Size 1.3MB
- # of Slides 2
- File Format PPTX
- Slide Ratio 4:3
- Color
Keywords
- #Content-Based Slides
- #Design-Based Slides
- #Market and Competitor Analysis
- #Diagram
- #Market Status
- #Market Analysis
- #Table
- #Standard Table
- #4:3
- #data table PowerPoint slide
- #comparison table template
- #horizontal table slide
- #market analysis chart
- #business data presentation
- #numerical data slide template
About the Product
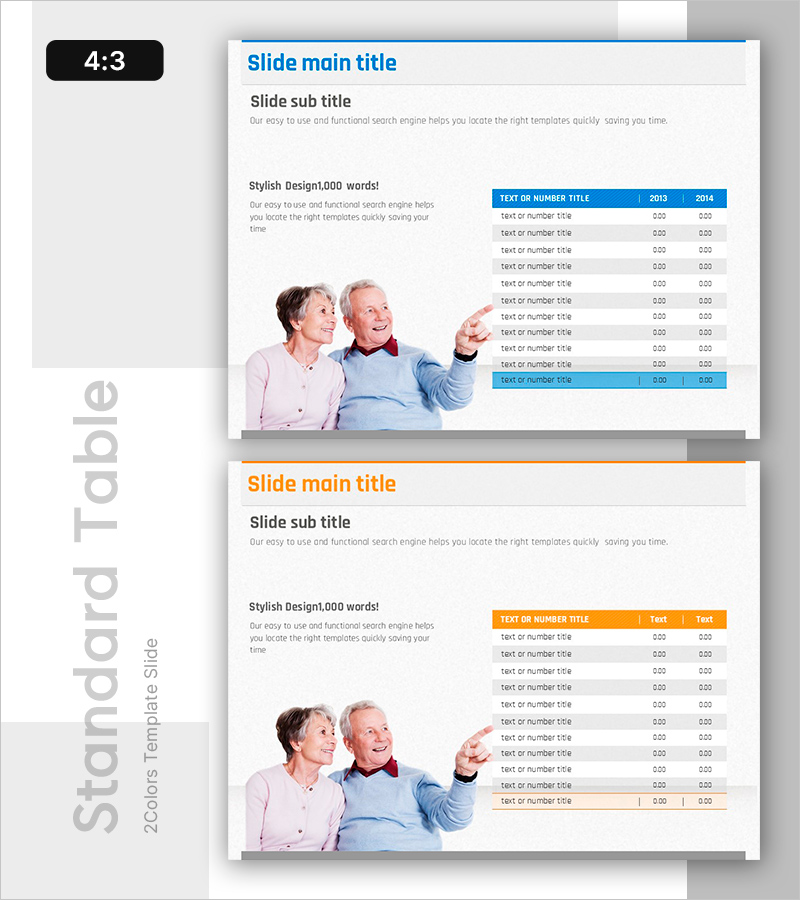
A horizontal data table PowerPoint slide designed for market analysis and execution planning. This presentation template includes 2 slides with blue and orange header variations to match different branding needs. Each table features 10 rows and 3 columns, optimized for comparing metrics across items and analyzing year-over-year performance. The text-based layout clearly organizes and emphasizes information, making it ideal for business proposals, market analysis reports, and educational materials that require structured data presentation.
Usage Points
-
Main Usage
This slide systematically organizes and compares numerical data and item-specific information in table format. It effectively communicates quantitative information such as market analysis figures, year-over-year performance, departmental results, and product feature comparisons.
-
How to Use
Select either the blue or orange header version that matches your presentation theme and brand colors. Input text and numerical data into each cell, and customize rows, columns, or colors as needed. Place this slide in the market analysis section of business proposals or the performance analysis page of reports.
-
Recommended For
Recommended for marketing professionals, planners, analysts, and educators delivering data-driven presentations. Ideal for organizing market research results, competitive analysis comparisons, departmental performance reports, and educational program evaluation materials.
-
Slide Structure
2-slide set. Each slide contains a horizontal table with a colored header row (blue or orange) displaying column titles and years, followed by 10 data rows. Cell backgrounds alternate between white and light gray for improved readability and visual hierarchy.
Related Products
-

Yellow Red Line Charts and Tables – Market Status Analysis
#Market and Competitor Analysis #Diagram #Graph
-

Business Status Chart – Presentation Template for Market Analysis
#Market and Competitor Analysis #Diagram #Graph
-

Usage Analysis Graph – Visualizing Market Status
#Market and Competitor Analysis #Diagram #Graph
-

Industrial Data Report for Market Analysis Slides
#Market and Competitor Analysis #Diagram #Graph
