Market Share Analysis of Wind and Solar Energy
RB0500010_7
- Last Update 03/13/2025
- File Size 3.1MB
- # of Slides 2
- File Format PPTX
- Slide Ratio 4:3
- Color
Keywords
About the Product
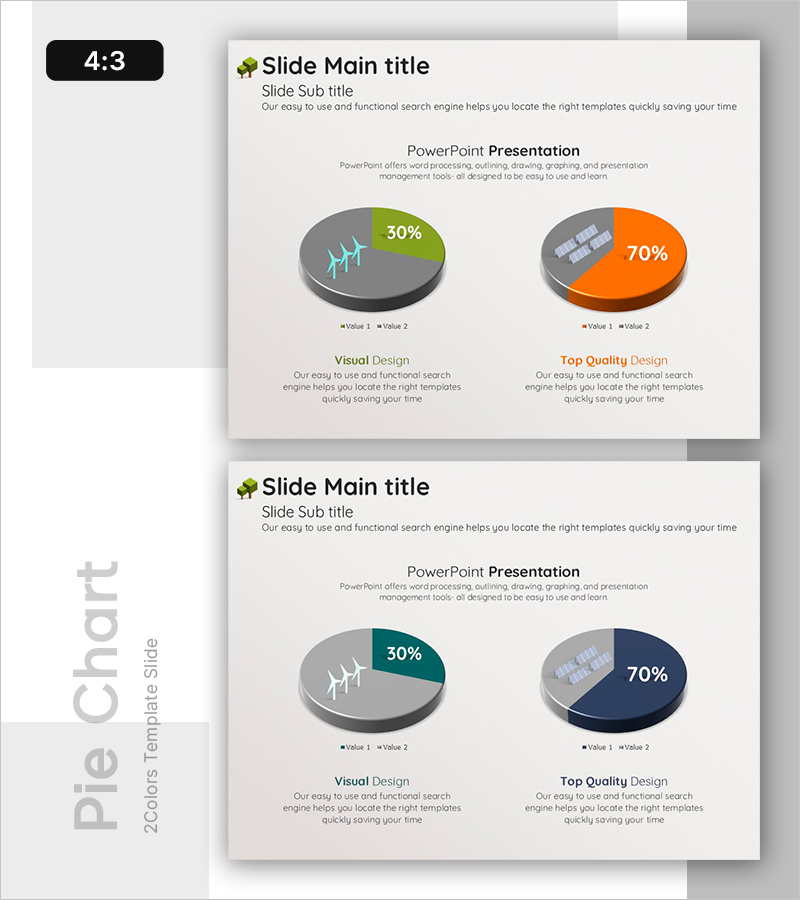
A 2-slide PowerPoint presentation featuring dual pie charts comparing wind and solar energy market share. The left chart displays a lime-green 30% segment against a gray background with supporting icons, while the right chart highlights an orange 70% segment. Each chart includes a legend and descriptive text area below for clear data interpretation. Available in 4:3 aspect ratio PPTX format, fully editable and ready for energy, environmental, and financial presentations.
Usage Points
-
Main Usage
Visualize market share distribution, competitive analysis, and renewable energy growth rates using two pie charts side-by-side. Color-coded segments and icons help audiences quickly grasp proportional differences between categories.
-
How to Use
Insert into investor presentations, quarterly business reports, and market analysis slides. Replace chart values and legends with your own data, adjust colors to match corporate branding, and the slide is ready for immediate use.
-
Recommended For
Energy sector professionals, market analysts, business strategists, investment managers, and consultants presenting comparative market data or portfolio composition analysis.
-
Slide Structure
Two-slide deck with dual 3D pie charts positioned side-by-side on each slide. Left chart features gray base with lime-green 30% segment; right chart features gray base with orange 70% segment. Legend labels (Value 1, Value 2) and descriptive text areas positioned below each chart for context.
Related Products
-

Travel Survey Results – Market Share Visualization
#Market and Competitor Analysis #Graph #Market Status
-

3D Pie Chart Analysis (Green & Blue) – Market Share Visualization
#Market and Competitor Analysis #Graph #Market Status
-

Pie Chart for Oriental Medicines Market Overview
#Market and Competitor Analysis #Graph #Market Status
-

Pie Chart for Market Share Analysis – Data Visualization
#Market and Competitor Analysis #Graph #Market Status
