Circular Program for Sustainability Slide
RB0500007-1_7
- Last Update 03/13/2025
- File Size 5.6MB
- # of Slides 2
- File Format PPTX
- Slide Ratio 4:3
- Color
Keywords
- #Content-Based Slides
- #Design-Based Slides
- #Corporate Social Responsibility
- #Diagram
- #Sustainability Programs
- #ESG
- #Flow
- #Circular Flow
- #4:3
- #circular diagram PowerPoint
- #3-stage cycle slide
- #sustainability presentation
- #ESG process diagram
- #environmental policy slide
- #circular economy PowerPoint template
About the Product
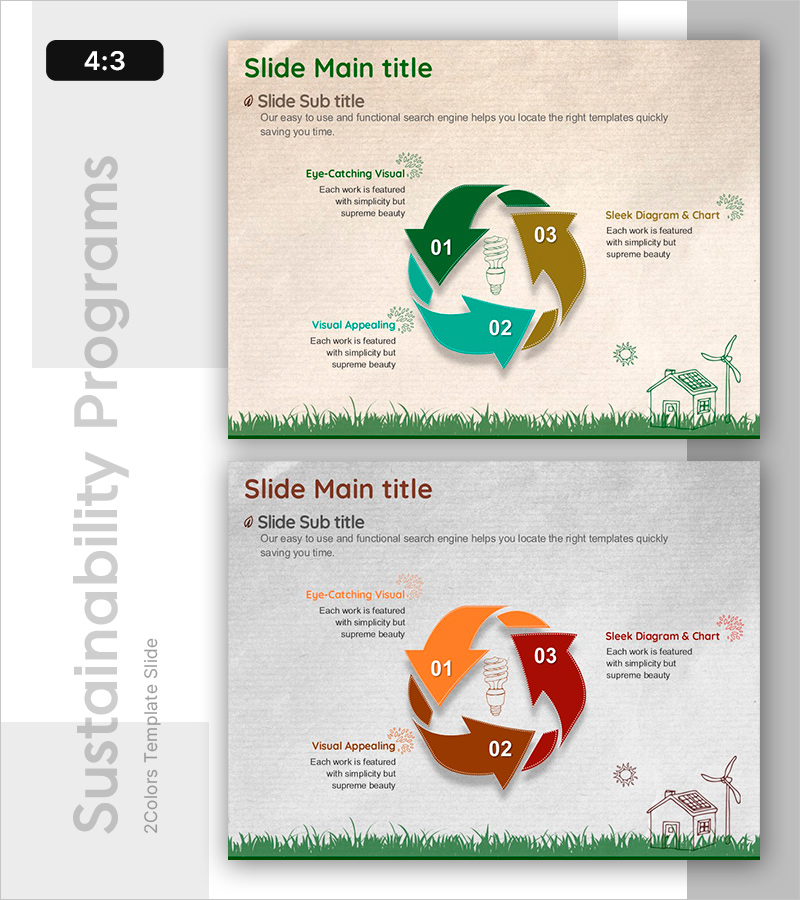
A 3-stage circular diagram PowerPoint slide designed to visualize sustainability strategies, ESG initiatives, and circular economy models. The diagram features clockwise-flowing arrows in green, brown, and teal colors that connect three sequential stages, each with dedicated icon and text areas for detailed explanations. The beige background is complemented by nature-inspired illustrations (grass, solar panels, buildings) that reinforce environmental messaging. Two color variations are provided—green and orange palette versions—allowing flexible brand alignment. Delivered in 4:3 aspect ratio PPTX format, fully editable and ready for immediate use in corporate presentations.
Usage Points
-
Main Usage
Clearly communicate corporate sustainability strategies, ESG frameworks, circular economy models, and environmental processes through a 3-stage circular structure. The arrow-based design emphasizes interconnectedness and sequential flow, enhancing audience comprehension of complex sustainability concepts.
-
How to Use
Integrate into company overviews, business plans, sustainability reports, and environmental policy presentations. Customize each stage by entering specific activities, targets, and outcomes in the text areas. Modify icons as needed to align with your organization's sustainability focus and brand identity.
-
Recommended For
ESG officers, sustainability strategy teams, corporate social responsibility (CSR) managers, environmental policy communicators, circular economy project leaders, and sustainability report authors seeking visual clarity in stakeholder presentations.
-
Slide Structure
Three interconnected nodes (01, 02, 03) arranged in clockwise circular flow with directional arrows. Each node contains dedicated title and description text areas plus icon placement zones. A central illustration (lightbulb, grass, building) anchors the design. Both slides maintain identical structure with color variation—one in green palette, one in orange palette.
Related Products
-

Recycle Circulation Diagram – Vision for Sustainable Development
#Corporate Social Responsibility #Diagram #Sustainability Programs
-

Practical Impacts of Adopting Eco-Friendly Energy – Sustainable Development
#Corporate Social Responsibility #Diagram #Sustainability Programs
-

Reuse Cycle Diagram Slide – Sustainability and Social Responsibility
#Operational Plan #Corporate Social Responsibility #Diagram
-

Cyclical Interaction of Natural Energy Flows
#Technical Approach #Corporate Social Responsibility #Diagram
