Recycle Circulation Diagram – Vision for Sustainable Development
RJ0600110_26
- Last Update 07/21/2025
- File Size 6.6MB
- # of Slides 2
- File Format PPTX
- Slide Ratio 16:9
- Color
Keywords
- #Content-Based Slides
- #Design-Based Slides
- #Corporate Social Responsibility
- #Diagram
- #Sustainability Programs
- #ESG
- #Flow
- #Circular Flow
- #16:9
- #circular diagram PowerPoint
- #recycling process slide
- #6-stage cycle diagram
- #environmental management presentation
- #ESG PowerPoint template
- #sustainability slide design
About the Product
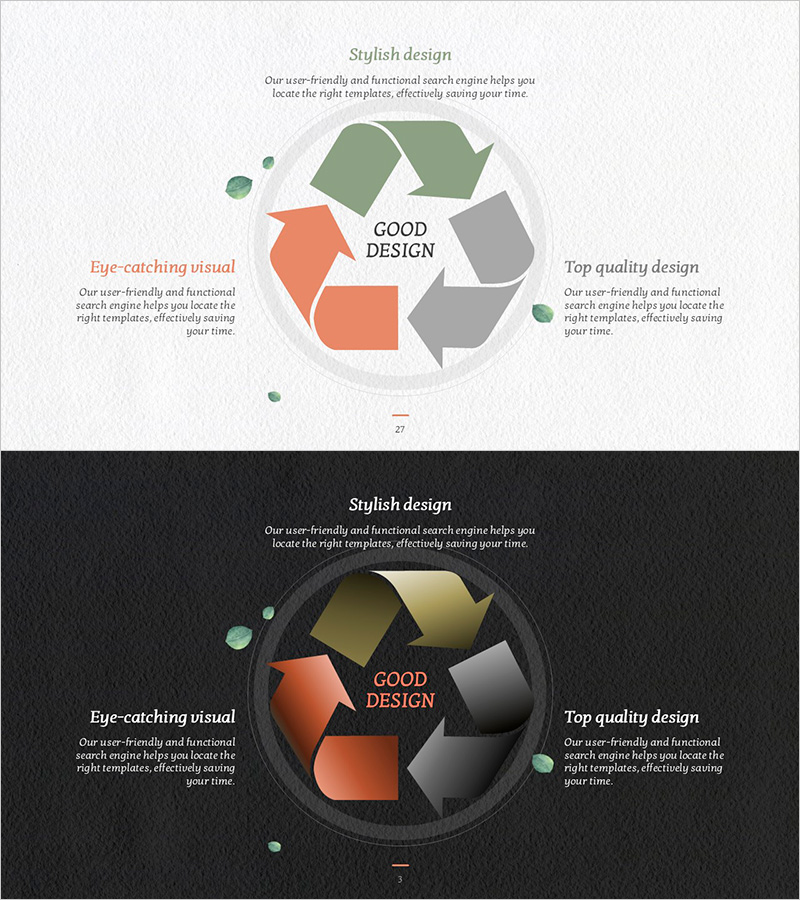
A 6-stage circular diagram PowerPoint slide that visualizes sustainable development and environmental management strategies. Polygon nodes in lime, orange, and gray tones connect clockwise to represent recycling cycles, business processes, and ESG initiatives with clear visual flow. Two background versions—light and dark—are provided for flexible presentation contexts. Each stage accommodates text and icons for immediate use in presentations, reports, and planning documents. Delivered as 2 slides in 16:9 widescreen format.
Usage Points
-
Main Usage
Effectively communicates circular economy strategies, recycling workflows, environmental management systems, ESG reporting, and sustainability initiatives through sequential stage visualization. Clearly illustrates interconnections and cyclical relationships between process stages.
-
How to Use
Input stage names, descriptions, and metrics into each polygon node to create a customized cycle diagram. Adjust colors to match brand identity. Select the light background version for projector presentations and the dark version for printed materials and digital documents.
-
Recommended For
Ideal for executives, planning teams, and marketing departments in environmental, energy, manufacturing, logistics, finance, and consulting sectors presenting ESG strategies, business process improvements, and circular economy models. Suitable for shareholder meetings, investor presentations, and internal training materials.
-
Slide Structure
Six polygon nodes arranged clockwise around a central circular border, connected by directional arrows to represent continuous flow. Central area for core messaging with additional text fields positioned in upper left and right corners for supplementary information.
Related Products
-

Circular Program for Sustainability Slide
#Corporate Social Responsibility #Diagram #Sustainability Programs
-

Reuse Cycle Diagram Slide – Sustainability and Social Responsibility
#Operational Plan #Corporate Social Responsibility #Diagram
-

Weather Mechanism Diagram – Climate Change and Sustainability
#Technical Approach #Corporate Social Responsibility #Diagram
-

Sustainable Renewable Energy Mechanism – A Vision for Environmental Protection
#Corporate Social Responsibility #Diagram #Environmental Protection Efforts
