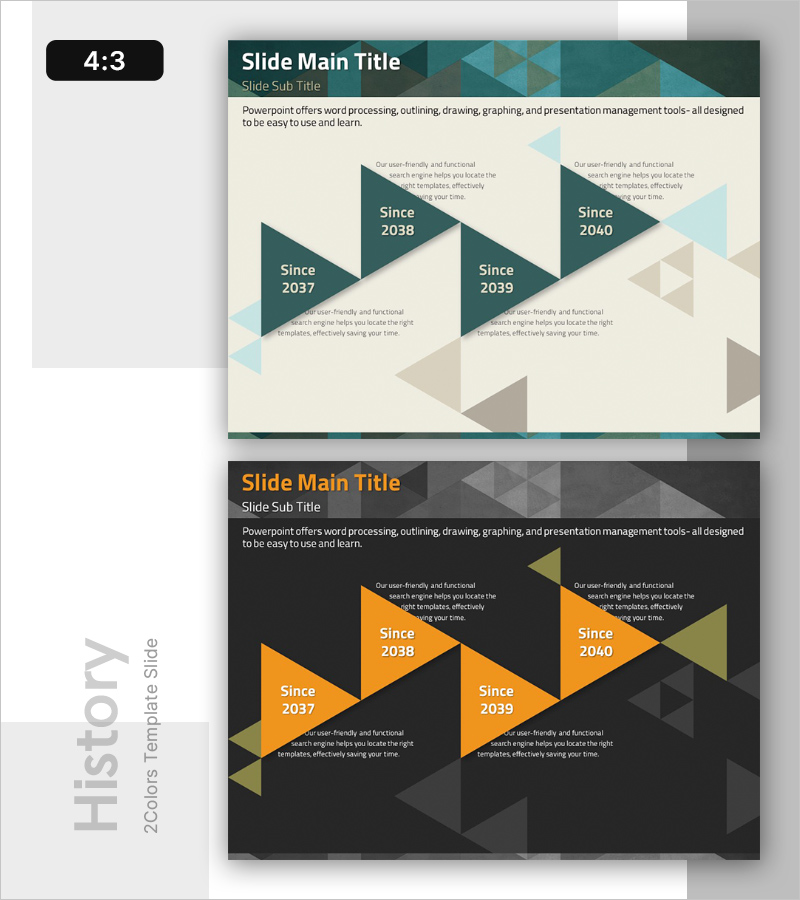
Triangular Timeline of Educational Milestones
RB0300048_4
- Last Update 03/11/2025
- File Size 0.7MB
- # of Slides 2
- File Format PPTX
- Slide Ratio 4:3
- Color
Keywords
- #Content-Based Slides
- #Design-Based Slides
- #Company Introduction
- #Business Strategy
- #Diagram
- #History
- #Implementation Framework
- #Cluster
- #Chain Diagram
- #4:3
- #triangular timeline PowerPoint
- #year-by-year milestone slide
- #4-stage diagram template
- #business roadmap presentation
- #timeline PowerPoint slide download
About the Product
A 4-stage triangular timeline PowerPoint slide that visualizes year-by-year progression from 2037 to 2040. This diagram uses left-pointing triangles to clearly express directional flow, making it ideal for presenting business initiatives, company milestones, and organizational history. The design combines teal and light-tone geometric backgrounds with dedicated text areas for each stage and year labels. Perfect for business presentations, strategic plans, and corporate timelines, this 4:3 ratio, 2-slide template is ready to download and customize immediately.
Usage Points
-
Main Usage
Presents business milestones, company history, and project timelines in chronological order. The left-pointing triangular diagram emphasizes directional progression, while dedicated text areas beneath each triangle allow for detailed descriptions of achievements and initiatives at each stage.
-
How to Use
Insert into company introduction sections of presentations, strategic planning documents, or annual reports. Fill each triangle with year labels and key achievements, then add supporting details in the text areas below to enhance audience comprehension and engagement.
-
Recommended For
Business strategists, marketing teams, executives preparing reports, educational institutions showcasing development history, and startups explaining growth stages. Ideal for company timelines, project roadmaps, organizational evolution, and any time-based information delivery.
-
Slide Structure
2-slide set featuring identical 4-stage triangular layouts in two color schemes: teal, light blue, and beige on slide 1; dark gray, orange, and olive on slide 2. Each triangle includes a year input field and two description text boxes, providing 8 total information entry areas across both slides.
Related Products
-

Timeline of Key Milestones – Capturing Business Strategy
#Company Introduction #Business Strategy #Diagram
-

Farm Company History Blue Green – Systematic and Efficient Cluster Format
#Company Introduction #Diagram #History
-

Mobile Finance Business History Diagram
#Company Introduction #Diagram #History
-

Big Data Development Plan by Year Slide
#Company Introduction #Business Management #Diagram
