Timeline of Key Milestones – Capturing Business Strategy
RB0100081_4
- Last Update 03/07/2025
- File Size 0.3MB
- # of Slides 2
- File Format PPTX
- Slide Ratio 4:3
- Color
Keywords
- #Content-Based Slides
- #Design-Based Slides
- #Company Introduction
- #Business Strategy
- #Diagram
- #History
- #Implementation Framework
- #Cluster
- #Chain Diagram
- #4:3
- #timeline milestone diagram PowerPoint
- #annual achievement flowchart
- #business progress slide template
- #how to create timeline diagram in PowerPoint
- #5-stage milestone presentation
About the Product
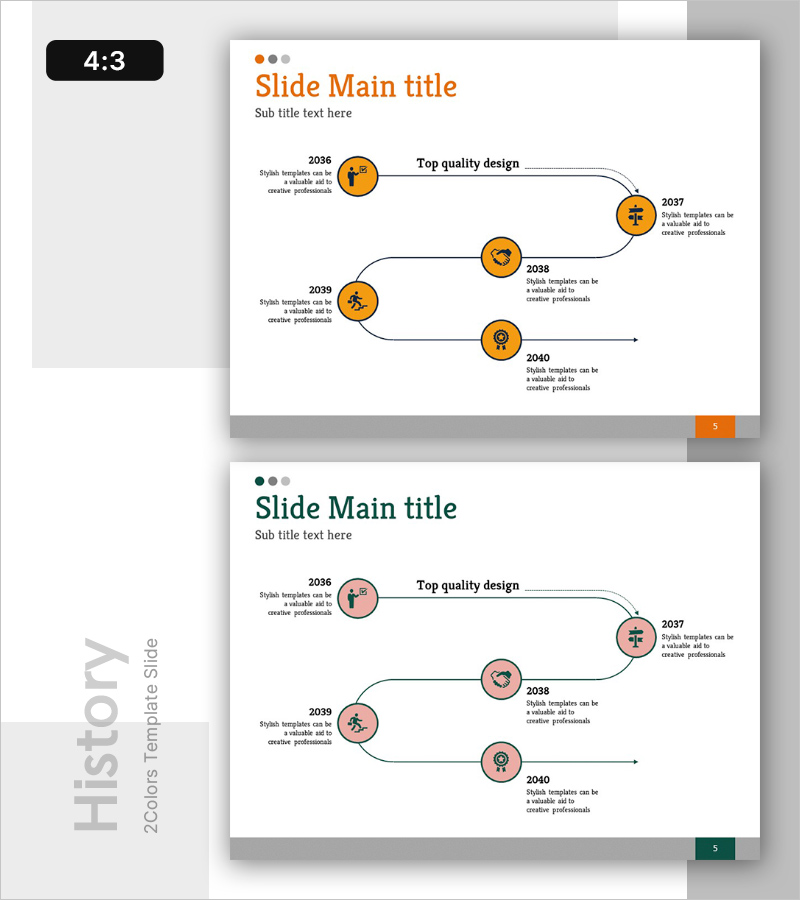
A timeline milestone diagram PowerPoint slide that visualizes annual key achievements and business strategy progression. Five orange circular nodes connected by flowing lines create a clear chronological structure, with text areas on both sides for detailed descriptions. This 4:3 ratio, 2-slide template is ready to use in presentations and reports. The diagram effectively communicates organizational growth milestones, project phases, and strategic business objectives through a visual timeline format.
Usage Points
-
Main Usage
Visualize annual key achievements, project milestones, and business objectives in chronological order to clearly communicate organizational growth and strategic progress. Ideal for executive reports, investor presentations, and annual business reviews where highlighting core accomplishments is essential.
-
How to Use
Enter year and key achievement in each circular node, then add detailed descriptions in the left and right text areas. Customize colors and icons to match different business domains (technology development, market expansion, organizational growth), and use for both presentation slides and printed materials.
-
Recommended For
Executives, business planning teams, marketing professionals, and investor relations specialists presenting business achievements and strategic progress. Suitable for company profiles, business plans, annual reports, and investment pitch decks emphasizing organizational growth trajectory.
-
Slide Structure
2-slide set with orange background on slide 1 and pink background on slide 2, both featuring identical timeline structure. Each slide contains 5 circular nodes with year labels, connecting lines, directional arrows, and left-right text areas for descriptions. Optimized for 4:3 aspect ratio across all screen sizes.
Related Products
-

Triangular Timeline of Educational Milestones
#Company Introduction #Business Strategy #Diagram
-

Farm Company History Blue Green – Systematic and Efficient Cluster Format
#Company Introduction #Diagram #History
-

Company History Blue Green Diagram
#Company Introduction #Diagram #History
-

Timeline Diagram for Carbon Neutral Company History
#Company Introduction #Diagram #History
