Dinosaur Info Comparison Table – Market and Competitive Analysis
RB0300046_5
- Last Update 03/11/2025
- File Size 1.2MB
- # of Slides 2
- File Format PPTX
- Slide Ratio 4:3
- Color
Keywords
- #Content-Based Slides
- #Design-Based Slides
- #Technical Approach
- #Market and Competitor Analysis
- #Diagram
- #Service Implementation Plan
- #Market Analysis
- #Spread
- #Table
- #Centralized Diagram
- #Standard Table
- #4:3
- #comparison table PowerPoint
- #4-row table slide template
- #information comparison slide
- #market analysis table
- #data comparison PowerPoint slide
About the Product
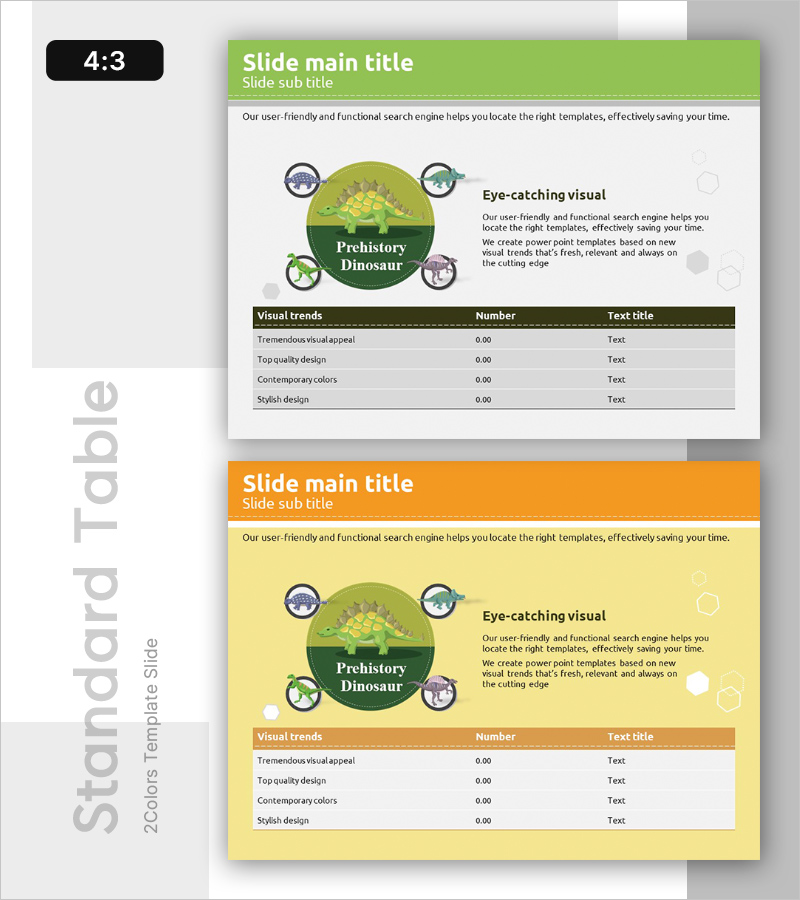
A 4-row comparison table PowerPoint slide for analyzing dinosaur characteristics at a glance. Featuring a green header and light gray data area, this slide deck provides clear visual hierarchy and includes icons for each row to enhance information delivery. Instantly applicable to various business presentations including market analysis, competitive comparison, and product feature comparison. Provided in 4:3 ratio with 2 slides, fully editable text and numerical fields for customization.
Usage Points
-
Main Usage
Optimized for comparing characteristics, metrics, and performance across multiple items in matrix format. Supports market research results, competitive analysis, product specification comparison, and departmental performance review to facilitate data-driven decision-making.
-
How to Use
Enter comparison item names in the header row (Visual trends, Number, Text title, etc.), then input corresponding data in each row. Use icon areas for category-specific visual representation, and customize background colors and fonts to match your corporate brand guidelines.
-
Recommended For
Marketing plans, business reports, product presentations, market analysis documents, and executive briefings. Suitable for marketing professionals, planners, sales teams, and executives who need to present comparative information.
-
Slide Structure
4-row × 3-column table layout with dark green header row (Visual trends, Number, Text title) and three light gray data input rows. Four circular icons positioned on the left side visually distinguish each row. Includes 2 slides with identical layout for consistent presentation flow.
Related Products
-

Analyzing Market Share with 3 Donut Charts and Tables
#Market and Competitor Analysis #Diagram #Graph
-

SWOT Segmentation Diagram – The Perfect Choice for Market Analysis
#Market and Competitor Analysis #Diagram #SWOT Analysis
-

Pentagon Diagram & Table Chart – Market Analysis and Competitive Insight
#Market and Competitor Analysis #Diagram #Market Analysis
-

Market Analysis Donut Chart & Table Slide
#Market and Competitor Analysis #Diagram #Graph
