Virus Theme Chart – Diagram for Market Analysis
RJ0700023_9
- Last Update 08/29/2025
- File Size 0.8MB
- # of Slides 2
- File Format PPTX
- Slide Ratio 16:9
- Color
Keywords
About the Product
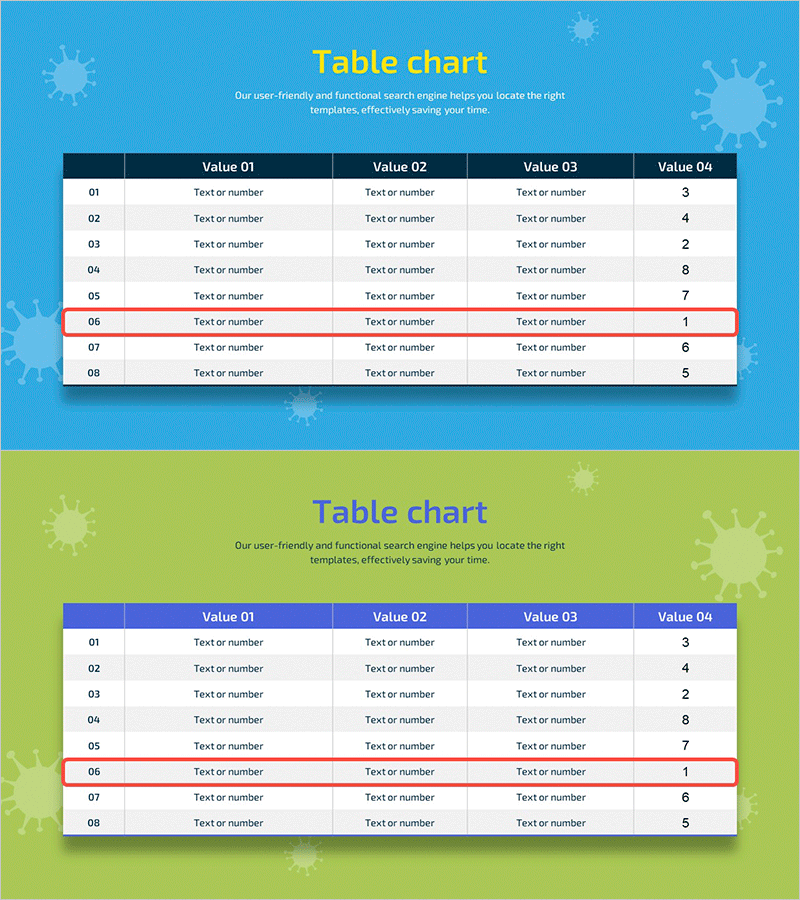
A professional 8-row table PowerPoint slide designed for organizing market data, business metrics, sales performance, and comparative analysis. Features a cyan-colored header row with white data cells and a red-highlighted row (row 06) to emphasize key information. Each row is numbered 01–08, with four columns (Value 01–04) for text or numerical input. Virus-themed decorative elements appear in the background, making it suitable for healthcare, medical, and environmental presentations. The 2-slide set includes both cyan and green background versions, allowing you to match your presentation theme.
Usage Points
-
Main Usage
Organize and visualize numerical data, comparative items, and performance metrics in a clear tabular format. The row highlight feature draws attention to key indicators or target values, making information retrieval and comparative analysis straightforward and professional.
-
How to Use
Enter text or numbers into each cell to populate your data. Modify the highlight row (row 06) color to emphasize important items, or add/remove rows as needed. Select your preferred background color (cyan or green) to match your presentation's overall design theme.
-
Recommended For
Executive reports, quarterly performance presentations, market research findings, sales performance analysis, budget planning meetings, departmental performance reviews, customer satisfaction survey results, and any business presentation requiring organized quantitative data display.
-
Slide Structure
2-slide set with 8-row × 4-column table layout. Header row (Value 01–04) features cyan background; data rows (01–08) have white background. Row 06 is highlighted in red for emphasis. Virus-themed icons decorate the background. Slide 1 uses cyan background; Slide 2 uses green background.
Related Products
-

Asia Map and Table Chart – Market Analysis and Marketing Strategies
#Market and Competitor Analysis #Marketing Plan and Strategy #Diagram
-

Neuroscience Topic Analysis and Pie Charts – Market Share Visualization
#Market and Competitor Analysis #Diagram #Graph
-

Target Market Analysis Table
#Company Introduction #Market and Competitor Analysis #Diagram
-

Blackboard and Comparison Table Chart – Optimized for Market and Competitor Analysis
#Market and Competitor Analysis #Diagram #Competitor Analysis
