Section Performance Analysis Bar Chart – Competitor Analysis and Market Strategy
RB0300044_4
- Last Update 03/11/2025
- File Size 0.7MB
- # of Slides 2
- File Format PPTX
- Slide Ratio 4:3
- Color
Keywords
- #Content-Based Slides
- #Design-Based Slides
- #Business Vision and Strategy
- #Market and Competitor Analysis
- #Graph
- #Core Competencies
- #Customer Analysis
- #Competitor Analysis
- #Column
- #Segmented Column
- #4:3
- #stacked bar chart PowerPoint
- #data comparison slide template
- #vertical bar graph presentation
- #business analysis chart
- #competitive analysis PPT slide
About the Product
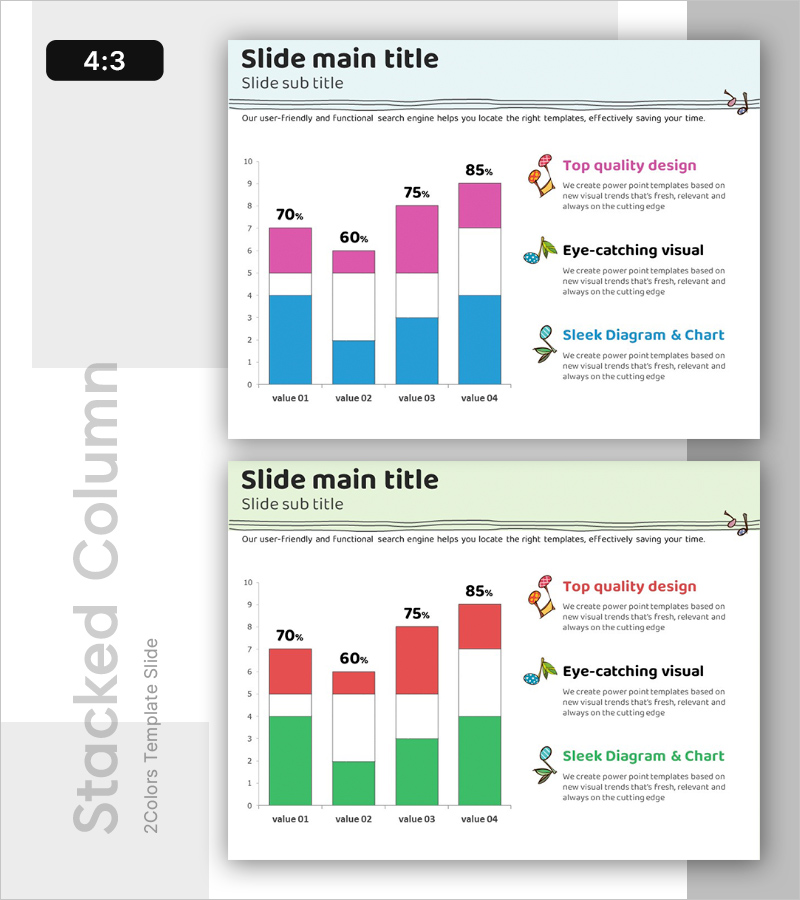
A 2-slide PowerPoint template featuring a stacked bar chart that compares four data values with dual-color visualization. The chart uses blue and pink tones to represent baseline and cumulative data simultaneously, with percentage labels (70%, 60%, 75%, 85%) displayed above each bar for clarity. Designed for business reports, competitive analysis, market strategy presentations, and performance reviews. The 4:3 PPTX format allows full customization of data, labels, and accompanying text boxes. Includes three annotation callouts on the right side explaining key insights.
Usage Points
-
Main Usage
Visualizes comparative data across four categories while showing both component values and cumulative totals. Perfect for presenting competitive benchmarking, market share analysis, departmental performance metrics, and financial comparisons in executive presentations and investor pitches.
-
How to Use
Insert into quarterly business reviews, board presentations, marketing strategy meetings, and investor relations decks. Modify the data values, category labels, and annotation text to match your specific analysis. The dual-color scheme emphasizes the breakdown between baseline and additional metrics.
-
Recommended For
Business executives, marketing managers, sales directors, management consultants, financial analysts, and data scientists who need to communicate quantitative performance metrics. Particularly useful for competitive analysis, market research, financial reporting, and strategic planning presentations.
-
Slide Structure
Two slides with identical layout: stacked vertical bar chart with 4 categories (value 01–04), blue base segments and pink top segments, percentage labels above bars, and three right-aligned callout boxes with icons and descriptive text. Slide 2 features an alternative color scheme (red and green) for variety.
Related Products
-

Orange Hexagon Presentation Template Segmented Vertical Bar Graph – Market and Competitive Analysis
#Market and Competitor Analysis #Graph #Other
-

Newspaper Wide PowerPoint Template Bar Chart – Effective Market Analysis Tool
#Market and Competitor Analysis #Marketing Plan and Strategy #Graph
-

Graph of the Effects of Harmony on a Child – Understanding Customers
#Market and Competitor Analysis #Graph #Other
-

Medical Services Characteristics Connection Diagram
#Market and Competitor Analysis #Graph #Customer Analysis
