User Gender Ratio Analysis Graph – Customer Insights
RJ0300037_14
- Last Update 04/27/2025
- File Size 1.3MB
- # of Slides 2
- File Format PPTX
- Slide Ratio 16:9
- Color
Keywords
- #Content-Based Slides
- #Design-Based Slides
- #Market and Competitor Analysis
- #Graph
- #Customer Analysis
- #Competitor Analysis
- #Horizontal Bar
- #Double Horizontal Bar
- #16:9
- #dual bar chart PowerPoint
- #horizontal bar comparison slide
- #gender ratio analysis presentation
- #customer analytics chart
- #market analysis graph
About the Product
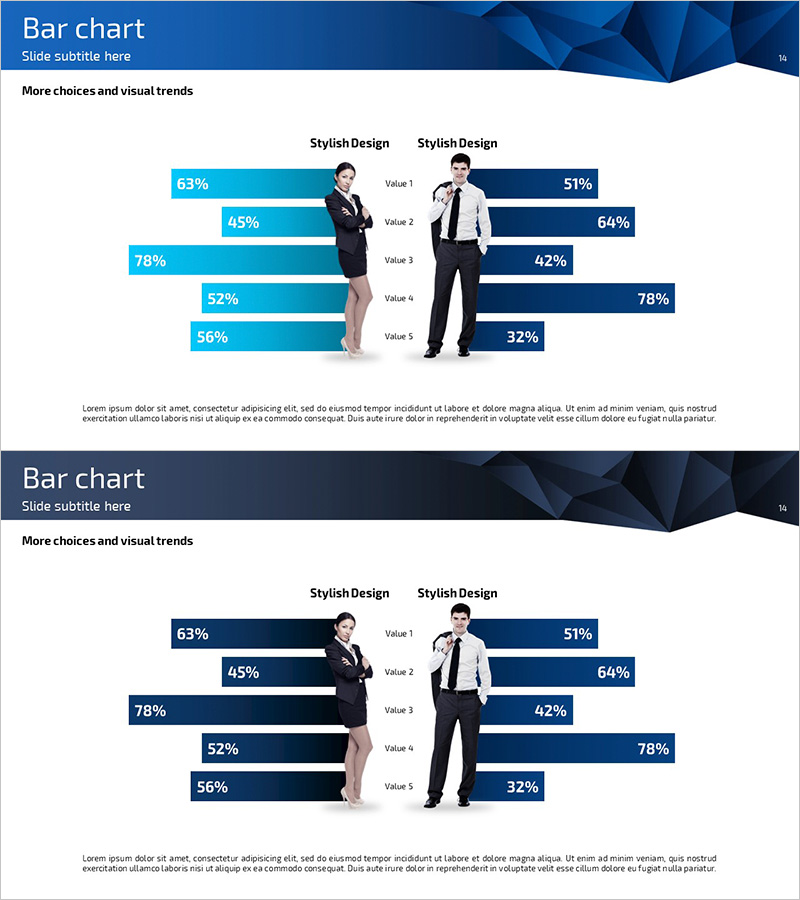
A dual horizontal bar chart PowerPoint slide designed for analyzing user gender ratio distribution. The contrasting color scheme—light blue bars on the left and dark blue bars on the right—clearly distinguishes between two data groups across five items. Each bar displays percentage values, making it ideal for customer insights presentations, market analysis reports, and user segmentation discussions. The 16:9 widescreen format with 2-slide layout adapts seamlessly to various presentation environments and business contexts.
Usage Points
-
Main Usage
Visually compare and analyze gender or demographic ratios across multiple data points. Commonly used in marketing reports, market research presentations, customer segmentation analyses, and business intelligence dashboards to present two-group comparisons side by side.
-
How to Use
Replace the percentage values with your actual data. Assign the light blue bars (left) to one demographic group and dark blue bars (right) to another group. The slide automatically scales to accommodate your data, enabling quick integration into presentations.
-
Recommended For
Marketing teams presenting customer demographics, business planning teams analyzing market segmentation, data analysts sharing statistical findings, and executives reviewing business performance reports. Ideal for any two-group comparative analysis in professional settings.
-
Slide Structure
2-slide deck featuring dual horizontal bar charts with 5 items per slide. Each item displays paired bars—light blue (left) and dark blue (right)—with percentage labels. Central placement of business figures provides visual balance and professional appearance.
Related Products
-

Gender Ratio Analysis Bar Graph – Customer Analysis and Competitive Advantage
#Market and Competitor Analysis #Graph #Customer Analysis
-

Horizontal Bar Graph for Cooking Competition
#Market and Competitor Analysis #Graph #Competitor Analysis
-

Competitive Advantage Bar Graph – Market and Competitor Analysis
#Market and Competitor Analysis #Graph #Competitor Analysis
-

Male and Female Comparison Analysis Horizontal Bar Graph – Results and Insights
#Market and Competitor Analysis #Graph #Customer Analysis
