Timeline of Educational Program Development – Visual Cluster Diagram
RB0300006_4
- Last Update 03/09/2025
- File Size 0.8MB
- # of Slides 2
- File Format PPTX
- Slide Ratio 4:3
- Color
Keywords
- #Content-Based Slides
- #Design-Based Slides
- #Company Introduction
- #Business Management
- #Diagram
- #History
- #Execution Plan
- #Cluster
- #Closed Cluster Diagram
- #Chain Diagram
- #4:3
- #cluster diagram PowerPoint
- #connected diagram slide template
- #3-node timeline slide
- #educational program diagram
- #corporate history PPT slide
About the Product
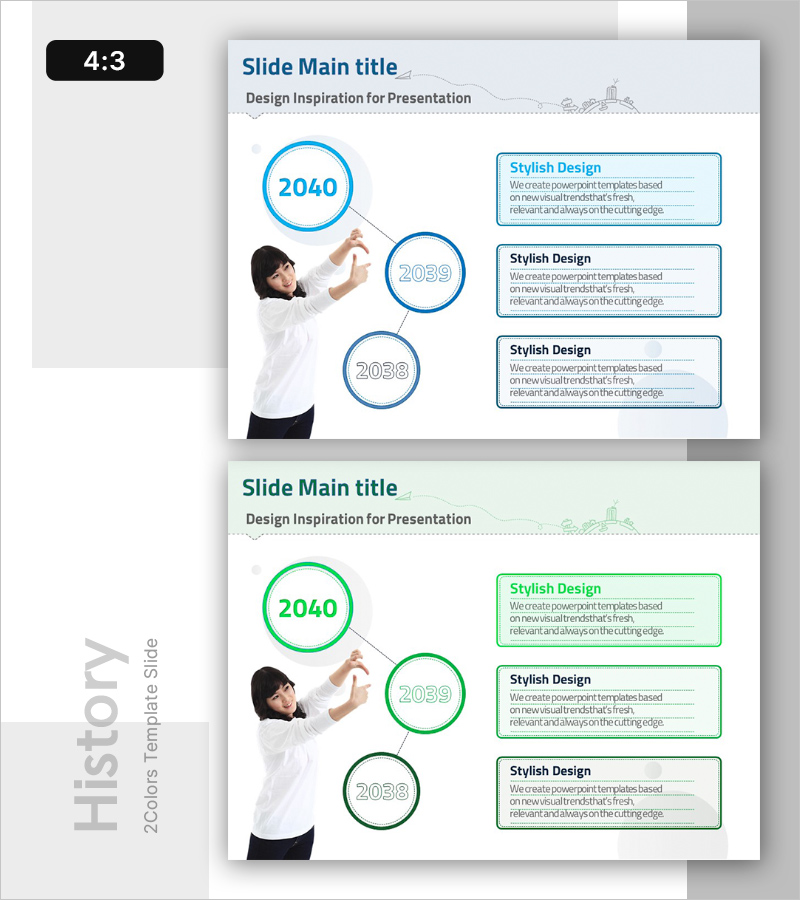
A cluster diagram PowerPoint slide that visualizes educational program development timelines, corporate growth stages, and project progression through three circular nodes. The structure features one large central node connected by dotted lines to two smaller nodes positioned at the lower left, expressing both hierarchical relationships and temporal flow simultaneously. The design uses light blue circular borders and dotted connectors for clean information architecture, with three text boxes on the right side for detailed descriptions of each stage. This 4:3 ratio, 2-slide template is ready for immediate editing and presentation use.
Usage Points
-
Main Usage
Ideal for expressing hierarchical relationships and temporal progression among three elements such as educational program development phases, corporate growth stages, or project milestones. The central node represents the core concept while lower nodes function as detailed stages or related components, clearly communicating causality and interconnection.
-
How to Use
Double-click each circular node to enter years, stage names, or concepts. Add descriptions, achievements, or characteristics in the three right-side text boxes. Customize node colors or extend the relationship diagram by adding additional connector lines as needed.
-
Recommended For
Ideal for educational institution program development history presentations, corporate introduction materials explaining growth phases, consulting proposal project roadmaps, and academic presentations of research progression. Particularly effective in executive reports and strategic planning meetings where relationships among three key elements require emphasis.
-
Slide Structure
Slide 1: Title area + three circular nodes (one large central, two smaller at lower left) + dotted connector lines + three right-side text boxes. Slide 2: Identical structure in green color variant. All nodes support internal text editing, and text boxes are independently movable and resizable.
Related Products
-

Practice System Diagram - Business Promotion Strategy Visualization
#Business Strategy #Business Management #Diagram
-

Business History Step Diagram – Cluster and Connection
#Company Introduction #Business Management #Diagram
-

Isometric Eco-Friendly History – A Journey Towards Sustainability
#Company Introduction #Diagram #History
-

Urban-Based Business Timeline Flow – Capturing Visual Changes
#Company Introduction #Business Management #Diagram
