Business History Step Diagram – Cluster and Connection
RM0200002_5
- Last Update 02/01/2025
- File Size 1.9MB
- # of Slides 2
- File Format PPTX
- Slide Ratio 16:9
- Color
Keywords
- #Content-Based Slides
- #Design-Based Slides
- #Company Introduction
- #Business Management
- #Diagram
- #History
- #Execution Plan
- #Cluster
- #Chain Diagram
- #16:9
- #history timeline diagram PowerPoint
- #business milestone slide template
- #cluster connection diagram
- #company history presentation
- #how to create timeline in PowerPoint
About the Product
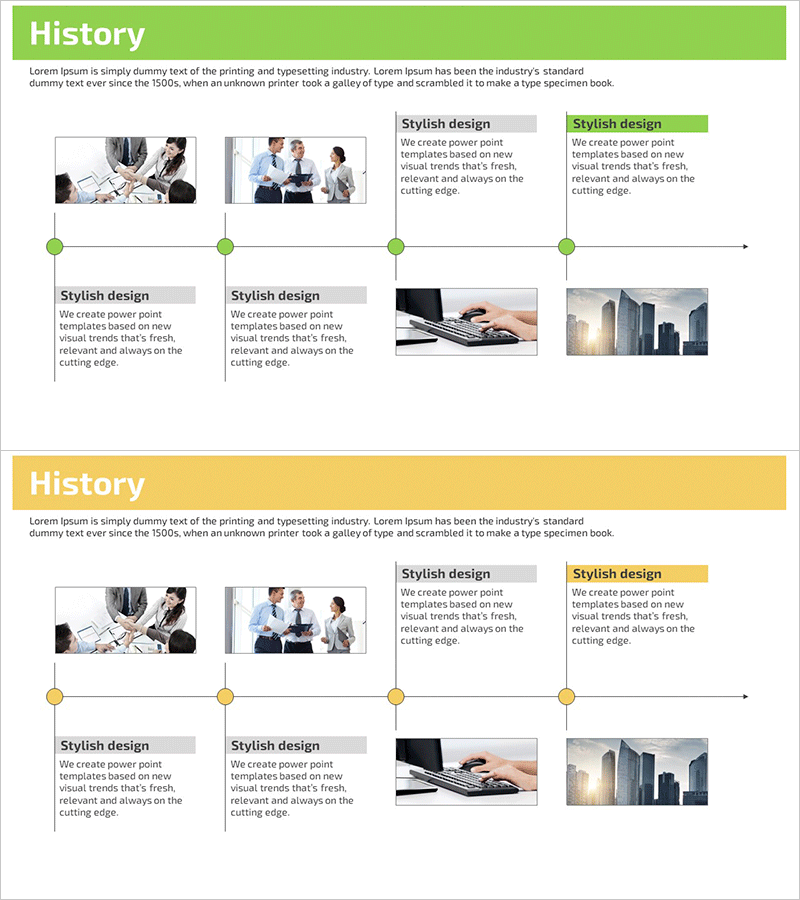
A professional timeline diagram PowerPoint slide designed to showcase your company's key development stages and milestones. This presentation template features two color schemes—green and yellow—with four nodes positioned along a horizontal timeline, each connected to image placeholders and descriptive text boxes. Perfect for illustrating corporate history, project progression, achievement milestones, and organizational growth. The 2-slide deck is optimized for 16:9 widescreen format, enabling seamless integration into modern business presentations and investor pitches.
Usage Points
-
Main Usage
Effectively communicate your company's growth trajectory and key milestones in chronological order, combining visual imagery with descriptive text to create a compelling narrative of organizational development. Ideal for investor presentations, corporate introductions, annual reports, and company history briefings.
-
How to Use
Insert key company events, product launches, or business expansion dates at each timeline node. Add relevant descriptions and achievements in the adjacent text boxes, and place corresponding images in the designated image areas to enhance visual impact and audience engagement.
-
Recommended For
Corporate executives, marketing professionals, investor relations specialists, and business development teams presenting company history or project progression. Particularly effective for startup growth stories, enterprise history overviews, and project phase explanations.
-
Slide Structure
Two-slide presentation with horizontal timeline as the central design element. Each slide features four nodes (green or yellow circles) positioned along the timeline, with each node connected to an image placeholder, descriptive text box, and title area, creating a systematic visual flow of information across time.
Related Products
-

Timeline of Middle School Education
#Company Introduction #Business Management #Diagram
-

Urban-Based Business Timeline Flow – Capturing Visual Changes
#Company Introduction #Business Management #Diagram
-

Timeline of Educational Program Development – Visual Cluster Diagram
#Company Introduction #Business Management #Diagram
-

Yearly Educational Theme Diagram – Positive Vision
#Company Introduction #Business Management #Diagram
