Timeline of Environmental Initiatives
RB0300002_4
- Last Update 03/09/2025
- File Size 0.8MB
- # of Slides 2
- File Format PPTX
- Slide Ratio 4:3
- Color
Keywords
- #Content-Based Slides
- #Design-Based Slides
- #Company Introduction
- #Business Management
- #Diagram
- #History
- #Implementation Plan
- #Cluster
- #Chain Diagram
- #4:3
- #timeline diagram PowerPoint
- #7-stage roadmap slide
- #environmental initiative presentation
- #year-by-year progress visualization
- #business milestone PowerPoint template
- #process flow diagram slide
About the Product
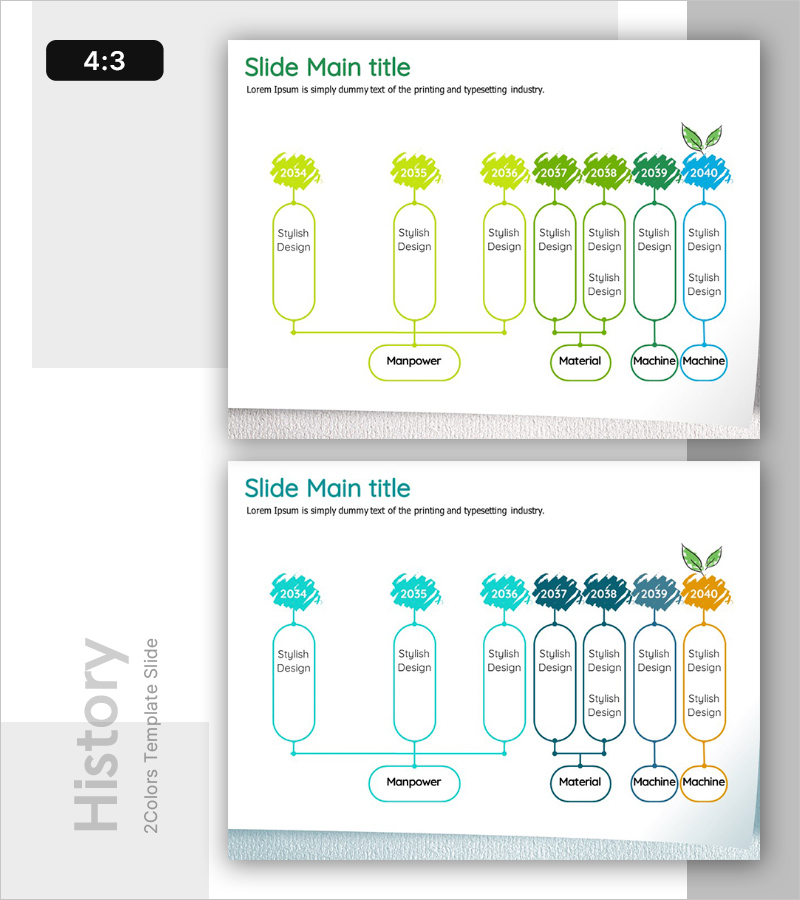
A PowerPoint slide visualizing a 7-year environmental initiative roadmap from 2034 to 2040. Each year is represented as an oval node with detailed objectives, while circular buttons at the bottom categorize implementation factors: Manpower, Material, and Machine. The lime-to-green-to-cyan-to-blue gradient color scheme symbolizes temporal progression and environmental commitment. Available in 4:3 aspect ratio with 2 slide variations, ready for business reports, strategy presentations, and sustainability initiatives.
Usage Points
-
Main Usage
Clearly visualize multi-year project timelines, environmental goals, and business milestones in chronological order. Simultaneously display year-by-year objectives and implementation factors (manpower, materials, machinery) to communicate complex roadmaps at a glance.
-
How to Use
Insert into business progress reports under 'Project Timeline' sections, strategy decks as 'Roadmap' pages, or sustainability presentations explaining year-by-year goal achievement. Fully editable text and color elements allow customization to match your organization's schedule and branding.
-
Recommended For
Environmental and sustainability officers, business strategy and planning teams, executives preparing progress reports, consulting and research firms, government and public sector officials presenting long-term policy initiatives or infrastructure projects.
-
Slide Structure
Slide 1: Seven oval nodes in lime-green-cyan-blue gradient representing years 2034–2040, each with editable text area, three circular buttons at base labeled Manpower, Material, Machine. Slide 2: Identical layout in cyan-blue tone variant. 4:3 aspect ratio, fully editable shapes and text boxes.
Related Products
-

Architectural History Roadmap – Development Through Clusters and Connections
#Company Introduction #Business Management #Diagram
-

History Speech Bubble Diagram - Visual Timeline Representation
#Company Introduction #Business Management #Diagram
-

Major Growth Process History Slide
#Company Introduction #Business Management #Diagram
-

Plan to Achieve Your Annual Business Goals
#Company Introduction #Business Management #Diagram
