Major Growth Process History Slide
RM0600003_5
- Last Update 02/23/2025
- File Size 0.8MB
- # of Slides 2
- File Format PPTX
- Slide Ratio 16:9
- Color
Keywords
- #Content-Based Slides
- #Design-Based Slides
- #Company Introduction
- #Business Management
- #Diagram
- #History
- #Implementation Plan
- #Cluster
- #Chain Diagram
- #16:9
- #history timeline PowerPoint
- #corporate growth diagram
- #company milestone slide template
- #5-stage timeline slide
- #business growth visualization PPT
About the Product
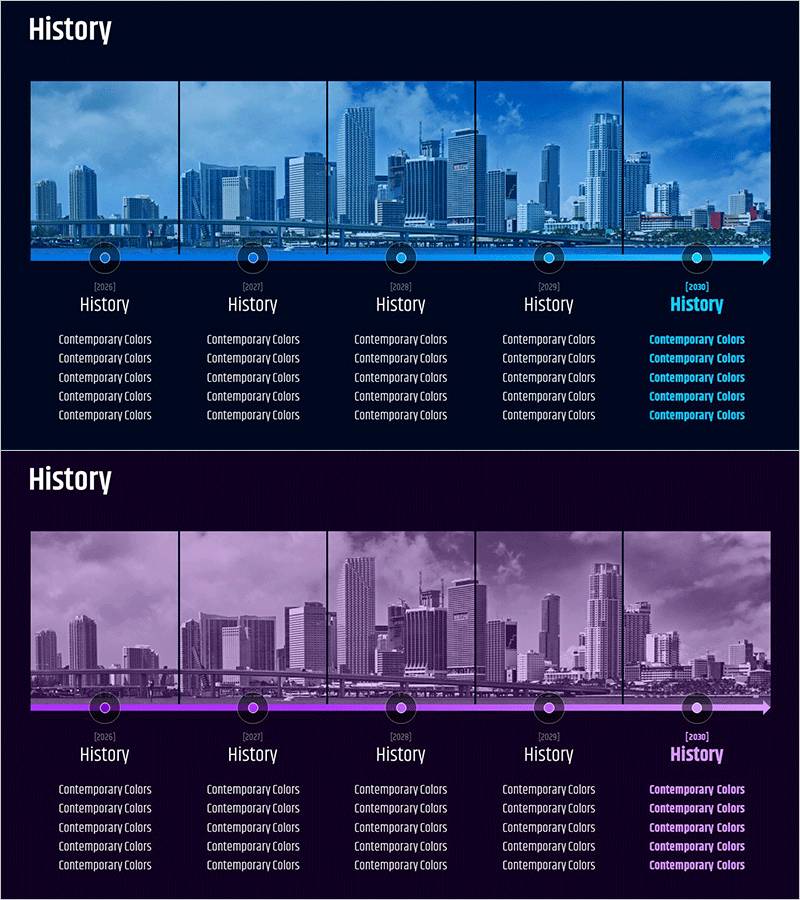
A 5-stage history timeline PowerPoint slide designed to visualize corporate growth milestones and key achievements. Provided in two color versions—blue tone and purple tone—with city skyline imagery as background for each stage, creating an intuitive representation of time progression and business expansion. Formatted in 16:9 widescreen ratio with 2 slides, each node features editable fields for year, title, and description text. Ideal for company presentations, business reports, investor pitch decks, and corporate history showcases.
Usage Points
-
Main Usage
Designed to chronologically present major corporate milestones and development phases in a visually compelling format. The 5-node connected structure clearly separates each stage's year, event, and achievement, enabling audiences to grasp the company's historical trajectory and growth narrative effectively.
-
How to Use
Input year and key events into each node's text fields, and customize background images with company-related photos. Select blue tone to emphasize trust and stability, or purple tone to highlight innovation and growth—choose based on your corporate brand identity and presentation context.
-
Recommended For
Recommended for corporate communications managers, investor relations (IR) professionals, executive report writers, and company presentation speakers. Particularly suited for startup growth stories, corporate heritage presentations, business expansion timelines, and organizational milestone showcases.
-
Slide Structure
Comprises 2 slides, each featuring a 5-node sequential timeline structure. Nodes consist of circular icons and text boxes connected by arrows to represent time flow. City skyline backgrounds reinforce the concepts of growth and development, creating visual coherence throughout the presentation.
Related Products
-

Concrete Theme History Diagram – Visualizing Company Development
#Company Introduction #Business Management #Diagram
-

Plan to Achieve Your Annual Business Goals
#Company Introduction #Business Management #Diagram
-

Round Square History Diagram – Visual Representation of Historical Flow
#Company Introduction #Business Management #Diagram
-

History Speech Bubble Diagram - Visual Timeline Representation
#Company Introduction #Business Management #Diagram
