Round Square History Diagram – Visual Representation of Historical Flow
RM0300004_5
- Last Update 02/07/2025
- File Size 0.3MB
- # of Slides 2
- File Format PPTX
- Slide Ratio 16:9
- Color
Keywords
About the Product
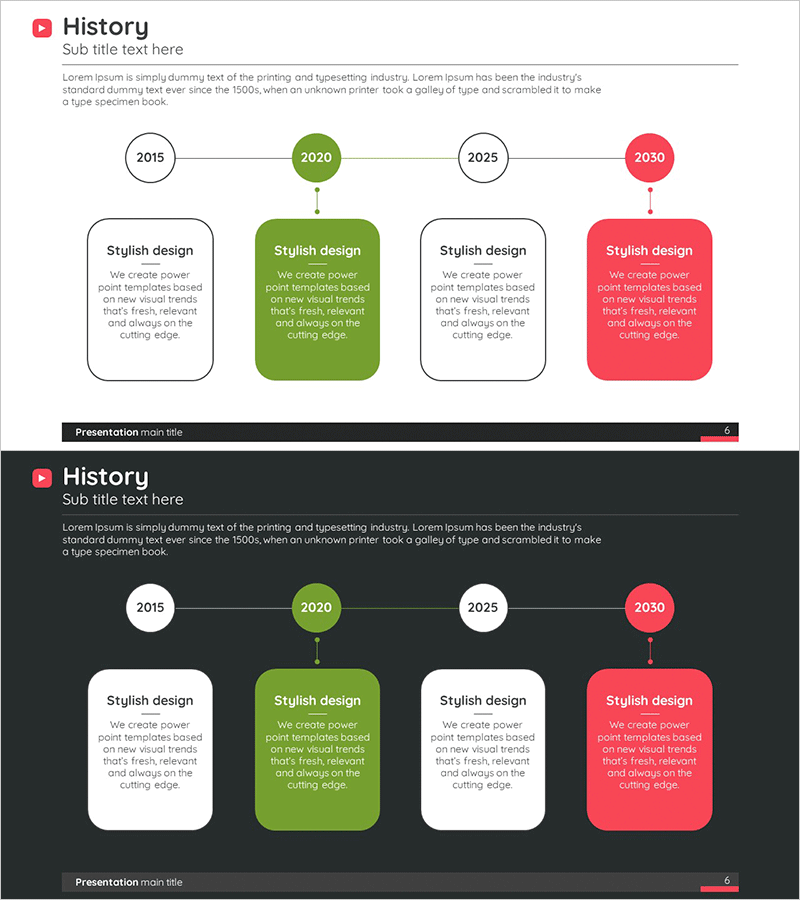
A 4-stage history timeline diagram PowerPoint slide that visually represents your company's historical milestones and growth journey. Circular nodes connected by vertical lines to rectangular text boxes clearly convey key events in chronological order. Three accent colors—white, green, and pink—distinguish the importance of each stage, making it ideal for company presentations and corporate overview decks. The 2-slide set includes both light and dark background versions, ready to use in any presentation environment without additional design work.
Usage Points
-
Main Usage
Visualize your company's founding, major milestones, and growth trajectory in chronological order to build credibility and trust with investors, clients, and employees through a clear historical narrative.
-
How to Use
Enter years and key events in the text boxes, and adjust colors to emphasize milestone importance. Use in company overview sections of corporate presentations, investor pitch decks, annual reports, and any business development or corporate communication materials.
-
Recommended For
Corporate communications managers, investor relations professionals, business development teams, executive presentation creators, and anyone presenting company history or organizational evolution in professional settings.
-
Slide Structure
Vertical timeline layout with 4 circular nodes (year indicators) each connected to a rectangular text box (description area). Nodes are color-coded in white, green, white, and pink; vertical connecting lines emphasize chronological progression and visual hierarchy.
Related Products
-

Key Achievement Timeline Diagram – Connecting Present and Future
#Company Introduction #Business Management #Diagram
-

Business History Diagram for Effective Business Management
#Company Introduction #Business Management #Diagram
-

Architectural History Roadmap – Development Through Clusters and Connections
#Company Introduction #Business Management #Diagram
-

Education Timeline Diagram – Key to Project Management
#Company Introduction #Business Management #Diagram
