Development Status of Satellite Tracking Systems
RB0200026_4
- Last Update 03/09/2025
- File Size 3.2MB
- # of Slides 2
- File Format PPTX
- Slide Ratio 4:3
- Color
Keywords
- #Content-Based Slides
- #Design-Based Slides
- #Product/Service Introduction
- #Market and Competitor Analysis
- #Graph
- #Development Status
- #Market Share
- #Circles
- #Doughnut Chart
- #4:3
- #donut chart PowerPoint slide
- #pie chart template
- #ratio visualization
- #development status chart
- #3-segment donut graph PowerPoint
About the Product
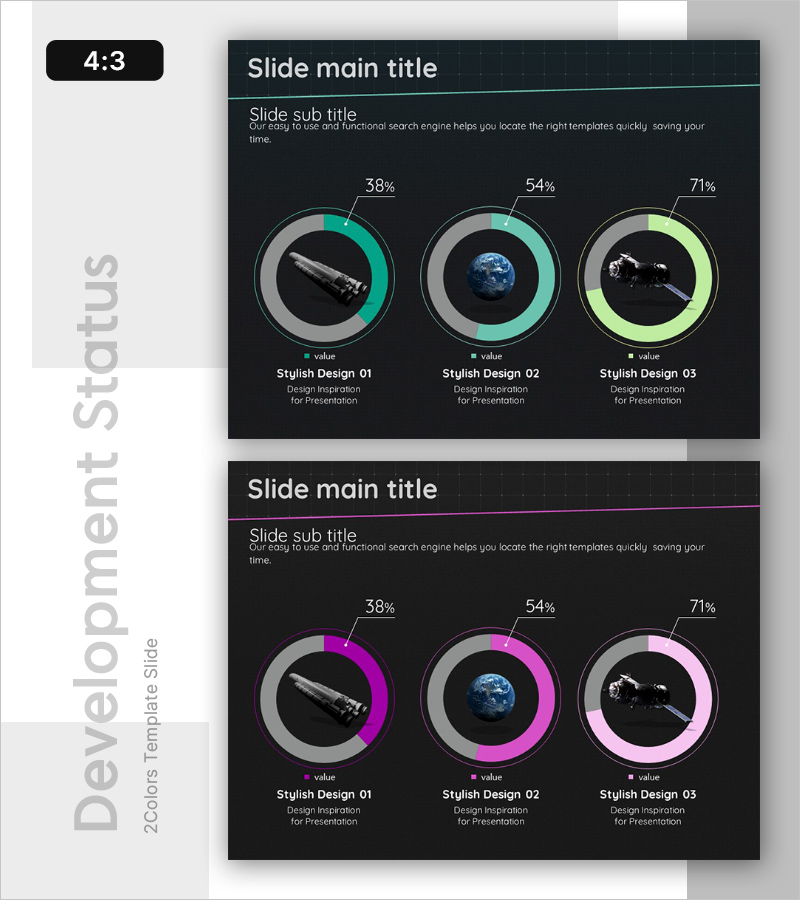
A donut chart PowerPoint slide designed to visualize satellite tracking system development status with three data segments. The slide features teal, lime, and gray color schemes with percentage values and clear labels for each section. Set against a dark background with high-contrast colors to maximize presentation impact, this slide is ready for immediate use in market share analysis, development progress tracking, and technology maturity assessments. Two color theme options (teal & lime / magenta & pink) allow you to match your presentation's visual tone.
Usage Points
-
Main Usage
Visualize satellite tracking systems, software development, and technology project progress—completion rates, market share, and performance metrics—using a three-segment donut chart. Ideal for technical presentations, business reports, and investor pitches where data credibility and visual clarity are essential.
-
How to Use
Simply replace the percentage values and labels with your own data. The teal and lime color scheme suits technology, aerospace, and IT presentations, while the magenta and pink theme emphasizes innovation and creativity. Use PowerPoint's shape editing tools to customize colors, sizes, and positions to match your brand guidelines.
-
Recommended For
Aerospace and satellite communications teams presenting technical progress, IT companies reporting quarterly project completion rates, investor presentations on technology maturity levels, and academic seminars visualizing research advancement metrics.
-
Slide Structure
Two-slide set. First slide features a teal, lime, and gray donut chart with 38%, 54%, and 71% values. Second slide presents an identical layout with magenta, pink, and lavender colors. Both slides include title and subtitle areas with three donut charts and legend placement for consistent data presentation.
Related Products
-

Development Status Analysis Donut Chart – Market Share Visualization
#Product/Service Introduction #Market and Competitor Analysis #Graph
-

Analysis of Work Progress – Utilizing Pie Chart
#Product/Service Introduction #Market and Competitor Analysis #Graph
-

Analysis graph of market share progress
#Product/Service Introduction #Market and Competitor Analysis #Graph
-

Sales Status Analysis Graph – Simple and Stylish Design
#Product/Service Introduction #Market and Competitor Analysis #Graph
