Construction Order Status Table – Optimal Choice for Business Analysis
RJ0900011_8
- Last Update 08/19/2025
- File Size 1.2MB
- # of Slides 2
- File Format PPTX
- Slide Ratio 16:9
- Color
Keywords
- #Content-Based Slides
- #Design-Based Slides
- #Business Management
- #Market and Competitor Analysis
- #Diagram
- #Project Organization and Roles and Responsibilities
- #Market Analysis
- #Table
- #Standard Table
- #16:9
- #construction order status table PowerPoint
- #data table slide template
- #business metrics presentation
- #construction industry analysis PPT
- #how to create data table in PowerPoint
About the Product
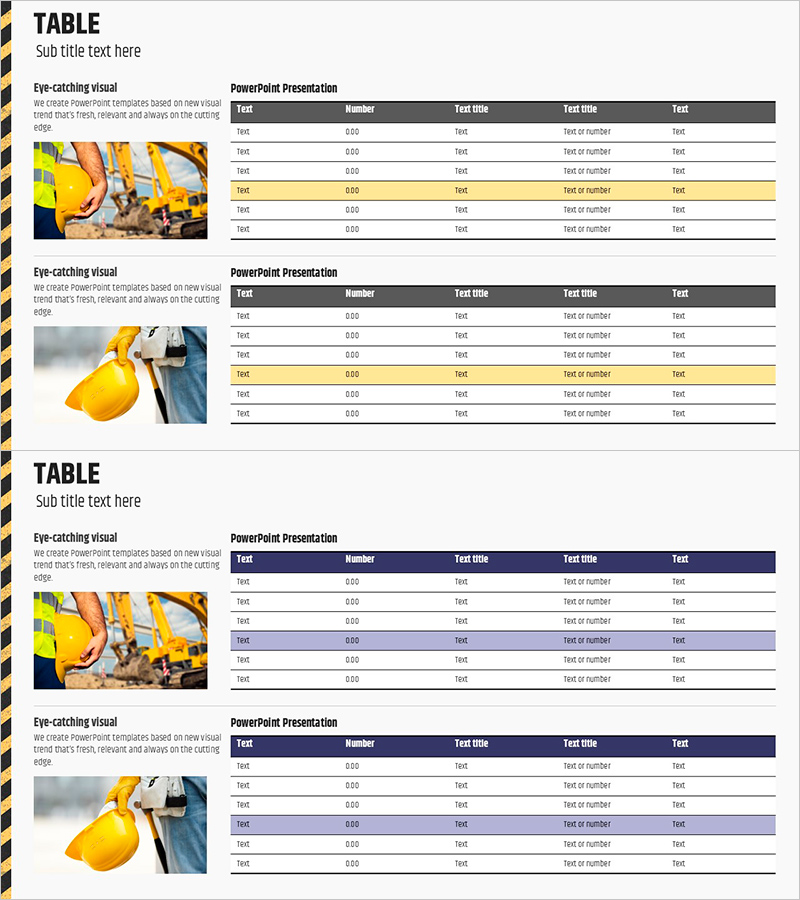
A structured table PowerPoint slide designed to organize construction project order status and business metrics. The 6-row by 5-column layout displays key information including project name, order amount, construction period, and project status at a glance. Features a dark gray header row, white data rows, and yellow highlight rows to visually distinguish critical items. Ideal for business analysis presentations, quarterly reports, investor briefings, and project portfolio reviews in the construction industry.
Usage Points
-
Main Usage
Visualize construction project portfolios, order status, and market analysis data in a structured table format for strategic decision-making. Enhance credibility of quantitative information in business plans, quarterly reports, investor presentations, and stakeholder communications.
-
How to Use
Input project names, order amounts, construction timelines, and status information into each table cell. Use yellow highlight rows to emphasize key projects or recent orders. Present row-by-row during presentations to guide audience attention through project details.
-
Recommended For
Construction company executives, sales teams, and business planning departments presenting order status and project portfolios. Suitable for bank loan reviews, investor meetings, partner briefings, and financial institution presentations requiring transparent project data.
-
Slide Structure
Two-slide set, each featuring a 6-row 5-column table with dark gray header (Test, Number, Test title, Test title, Test) and white data rows. Construction site imagery positioned on the left side of each slide provides visual context and industry relevance.
Related Products
-

Business Income Statement Table – Visualizing Financial Performance
#Market and Competitor Analysis #Financial Plans and Performance #Diagram
-

Visualize Market Trends and Cash Flow with Area Charts!
#Market and Competitor Analysis #Financial Plans and Performance #Graph
-

Analyzing Market Share with 3 Donut Charts and Tables
#Market and Competitor Analysis #Diagram #Graph
-

City Background Table – Design for Market Analysis
#Market and Competitor Analysis #Diagram #Market Analysis
