Visualizing Key Components of a Construction Project with Cluster Diagram
RB0100036_6
- Last Update 03/05/2025
- File Size 0.5MB
- # of Slides 2
- File Format PPTX
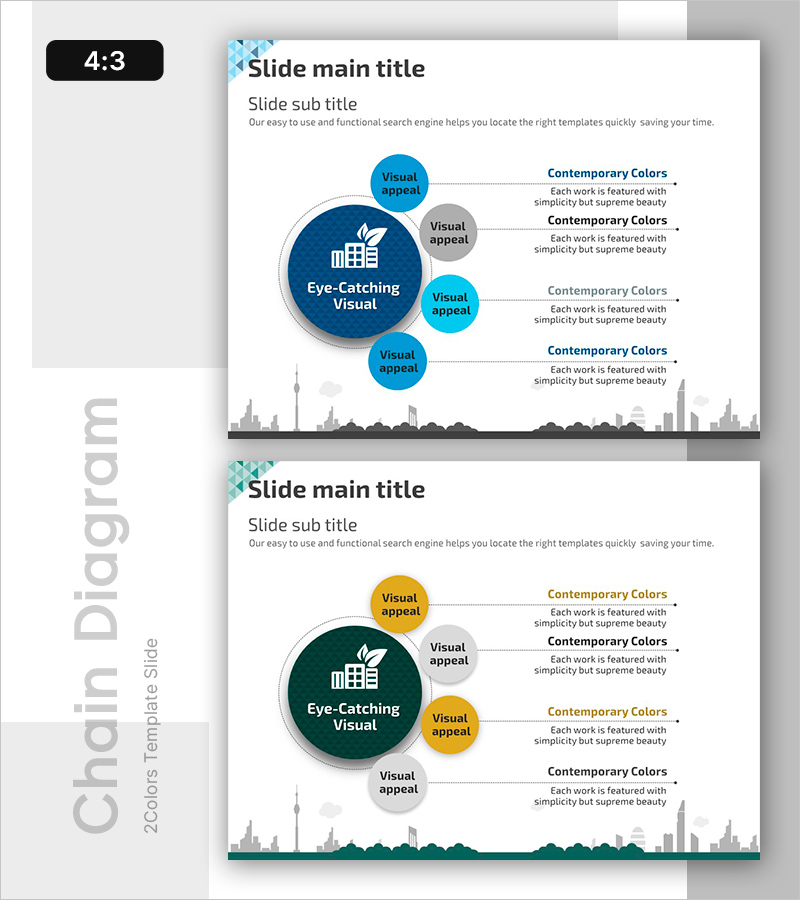
- Slide Ratio 4:3
- Color
Keywords
- #Content-Based Slides
- #Design-Based Slides
- #Business Management
- #Operational Plan
- #Diagram
- #Execution Plan
- #Production and Technology Development Strategy
- #Cluster
- #Chain Diagram
- #4:3
- #cluster diagram PowerPoint
- #central node slide template
- #relationship diagram
- #project elements visualization
- #connected diagram PowerPoint slide
About the Product
A cluster diagram PowerPoint slide that visualizes the relationships between a project's core concept and surrounding elements. The design features a large central circular node with four peripheral nodes connected by dotted lines, creating a clear hierarchical structure. The two-tone color scheme using dark blue and light blue distinguishes importance levels, while each node accommodates icons and text labels. This PowerPoint diagram is ideal for construction, project management, and business presentations where you need to clearly communicate the relationships between core elements and supporting components.
Usage Points
-
Main Usage
This diagram is designed to express hierarchical relationships between a project's core concept and surrounding elements. Place the main topic in the central node and arrange supporting items in peripheral nodes, connected by lines to clearly visualize their interdependencies. It's particularly effective for construction, IT, and business management presentations where you need to explain project structure and element connectivity.
-
How to Use
Enter your project name or core concept in the large central circular node, then populate the four surrounding nodes with key elements such as resources, budget, timeline, and quality. Edit the text and icons in each node to customize the diagram for your specific project needs, and adjust colors as desired. Insert the slide into presentations or reports to help audiences quickly understand complex project structures at a glance.
-
Recommended For
Project managers, professionals in construction, IT, and manufacturing industries, business planners, and anyone presenting organizational structures or system architectures. Ideal for business plans, proposals, project kickoff meetings, and executive reports where you need to effectively communicate core elements and their relationships.
-
Slide Structure
The 2-slide set features a central circular node (approximately 40% diameter) with four surrounding circular nodes connected by dotted lines. The central node uses dark blue gradient fill while peripheral nodes employ light blue and gray two-tone coloring for visual distinction. A text area on the right side allows for detailed descriptions of each element, and a city skyline background appears at the bottom of each slide.
Related Products
-

Painting Tools Diagram – Visualization of Clusters and Connections
#Business Management #Operational Plan #Diagram
-

Planning Line Chart – Business Strategy and Management
#Business Strategy #Business Management #Diagram
-

Simple PPT Wide Template Process – Intuitive Business Strategy Representation
#Business Strategy #Business Management #Diagram
-

Mountaineering Journey Diagram – Business Strategy and Efficiency
#Business Strategy #Business Management #Diagram
