Painting Tools Diagram – Visualization of Clusters and Connections
RJ0600068_10
- Last Update 07/08/2025
- File Size 5.7MB
- # of Slides 2
- File Format PPTX
- Slide Ratio 16:9
- Color
Keywords
- #Content-Based Slides
- #Design-Based Slides
- #Business Management
- #Operational Plan
- #Diagram
- #Execution Plan
- #Production and Technology Development Strategy
- #Cluster
- #Closed Cluster Diagram
- #Chain Diagram
- #16:9
- #circular node diagram PowerPoint
- #connection diagram slide template
- #4-step cluster visualization
- #process flow PowerPoint slide
- #relationship diagram presentation
About the Product
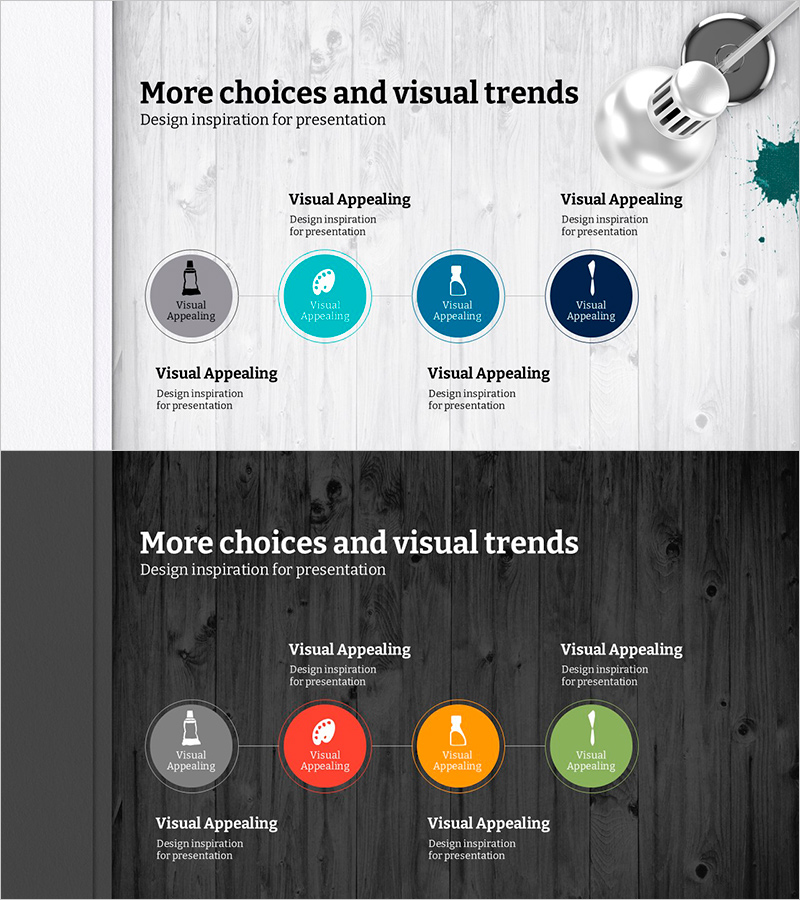
A PowerPoint slide featuring four circular nodes connected in linear sequence to visualize step-by-step relationships and cluster structures. The design combines a light wood-tone background with gray, cyan, blue, and navy circular nodes, each containing icon and text areas. This diagram effectively communicates process stages, organizational hierarchies, product lineups, and strategic roadmaps in presentations. The 2-slide set includes both light and dark background versions, adapting to various presentation environments and display settings.
Usage Points
-
Main Usage
Displays sequential stages, organizational hierarchies, product categories, and strategic roadmaps with four interconnected elements. Each node accommodates icons and descriptive text, making it ideal for illustrating business processes, team structures, service portfolios, and marketing phases across diverse professional contexts.
-
How to Use
Click each circular node to edit icons and text labels. Customize node colors by category or emphasis order. The linear connection structure intuitively conveys temporal sequence, cause-and-effect relationships, and hierarchical structures. Add animations aligned with presentation flow for enhanced audience engagement.
-
Recommended For
Ideal for business management, operational planning, strategy development, and organizational restructuring presentations. Project managers, strategic planners, organizational development specialists, and marketing professionals use this diagram to explain phased plans, team structures, product portfolios, and customer journeys.
-
Slide Structure
2-slide set with title area and 4-node circular diagram on each slide. Nodes feature central icon areas and bottom text labels, connected by linear arrows flowing left to right. First slide uses light wood-tone background; second slide features dark wood-tone background for design flexibility.
Related Products
-

Food Truck Connection Diagram - Operations and Marketing Strategy
#Operational Plan #Marketing Plan and Strategy #Diagram
-

Practice System Diagram - Business Promotion Strategy Visualization
#Business Strategy #Business Management #Diagram
-

Infographic Slide Visualizing Core Cosmetics Components
#Business Strategy #Operational Plan #Diagram
-

Timeline of Educational Program Development – Visual Cluster Diagram
#Company Introduction #Business Management #Diagram
