Illustration Map and Tree Analysis Slide – Operational Planning and Innovative Technology
RJ0600099_26
- Last Update 07/18/2025
- File Size 7.8MB
- # of Slides 2
- File Format PPTX
- Slide Ratio 16:9
- Color
Keywords
- #Content-Based Slides
- #Design-Based Slides
- #Operational Plan
- #Technical Approach
- #Diagram
- #Other
- #Production and Technology Development Strategy
- #Innovative Technologies and Future Plans
- #Cluster
- #Chain Diagram
- #16:9
- #world map PowerPoint slide
- #regional data diagram
- #cluster connection presentation
- #operational planning slide
- #technology analysis template
About the Product
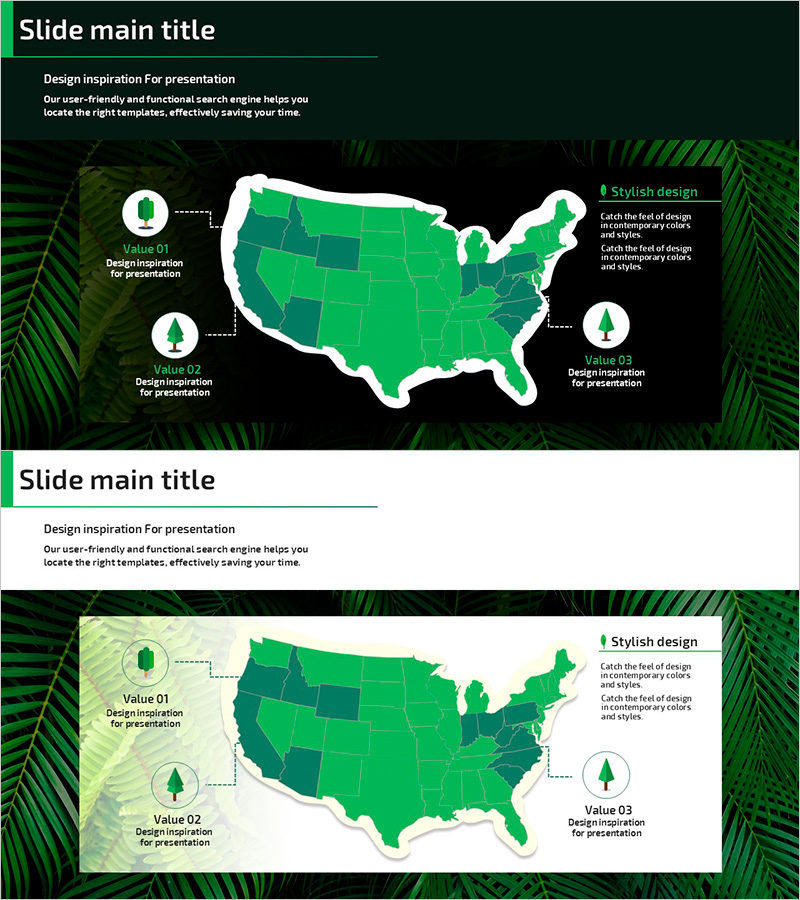
A cluster diagram PowerPoint slide featuring a US map with three regional nodes connected through dotted lines and icons. Multi-layered green color gradients (light, bright, and dark green) represent regional data hierarchy, while icons and connectors visualize operational planning, technology innovation, and strategic expansion. The 16:9 two-slide PPTX template is ready for immediate use in presentations, business plans, and reports.
Usage Points
-
Main Usage
Hierarchically connect regional and departmental data to express operational planning, technology strategy, and market expansion at a glance. Optimized for presentations requiring global network visualization, inter-regional interaction, and multi-point data connections.
-
How to Use
Slide 1 features a dark background with map and three icon nodes; edit node text to reflect operational planning, technology innovation, and strategy. Slide 2 offers a light background version suitable for printed presentations. Customize regional colors and icons to match organizational structure, departments, or projects.
-
Recommended For
Executives, planning teams, and operations teams explaining regional business expansion, technology rollout strategies, and global network development. Effective in business plans, strategic reports, technology seminars, and investor pitch decks emphasizing spatial information and data relationships.
-
Slide Structure
Slide 1 (dark background): US map centered, three circular icon nodes positioned left, right, and top, connected to map via dotted arrows. Slide 2 (light background): identical layout with print-friendly colors. Both slides include 'Stylish Design' text box on right for descriptive content.
Related Products
-

Agricultural Transport and Work Process – Efficient Business Strategy
#Business Strategy #Operational Plan #Diagram
-

Work Plan for Future Technologies – Innovation and Connectivity
#Operational Plan #Technical Approach #Diagram
-

Efficient Network Connectivity Diagram – Innovative Technology and Future Planning
#Operational Plan #Technical Approach #Diagram
-

Cluster Diagram Slide Visualizing a Scientific and Technological System
#Operational Plan #Technical Approach #Diagram
