Earth Science Trend Rocket Map – Innovative Technologies and Future Plans
RM0900009_6
- Last Update 10/07/2025
- File Size 26MB
- # of Slides 2
- File Format PPTX
- Slide Ratio 16:9
- Color
Keywords
- #Content-Based Slides
- #Design-Based Slides
- #Product/Service Introduction
- #Technical Approach
- #Diagram
- #Program Introduction
- #Innovative Technologies and Future Plans
- #Structure
- #Cluster
- #Pyramid Chart
- #Chain Diagram
- #16:9
- #pyramid diagram PowerPoint
- #6-stage connection slide
- #earth science presentation
- #hierarchical structure diagram
- #trend visualization slide
About the Product
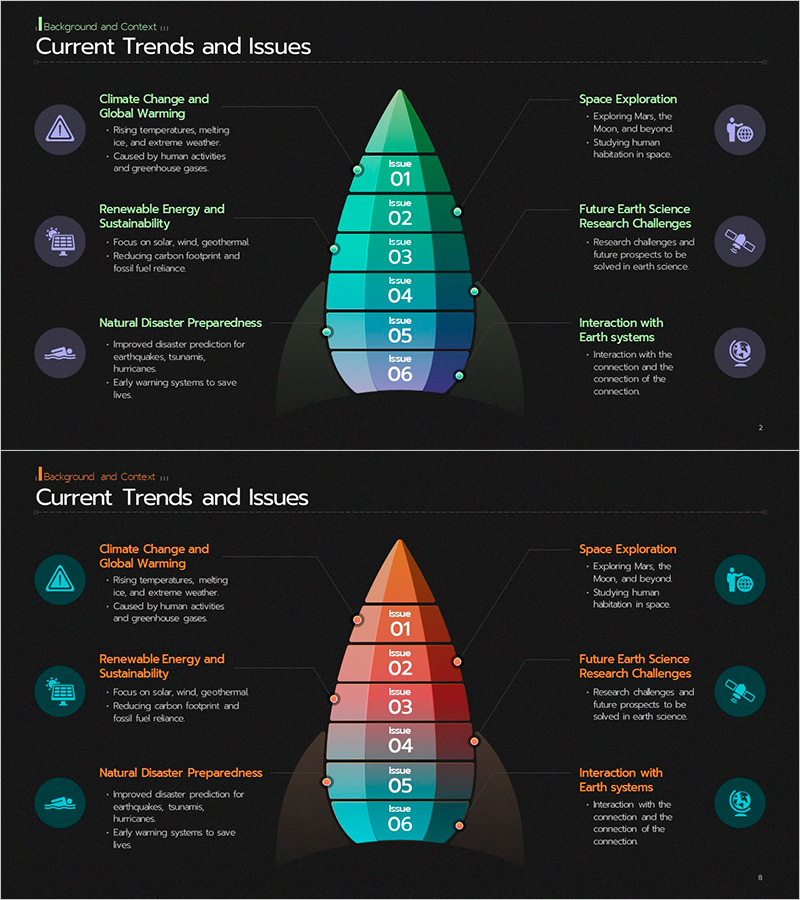
A PowerPoint slide that visualizes current trends and issues in earth science through a 6-stage pyramid structure. Climate change, renewable energy, natural disaster preparedness, space exploration, earth science research, and earth system interactions are presented hierarchically, with icons and descriptive text positioned on both sides of each stage to maximize information delivery. The color gradient transitioning from teal to purple and circular node connectors emphasize the relationships between stages. This PPT design is ideal for scientific presentations, educational seminars, and research reports where complex concepts need to be clearly structured.
Usage Points
-
Main Usage
Optimized for visualizing complex concepts hierarchically and showing stage-by-stage relationships. Effectively represents top-down classification from broad concepts to detailed items, or bottom-up progression from foundational stages to final objectives.
-
How to Use
Enter topic titles and descriptions in each stage's text area, and customize the left and right icons to match your categories. The color gradient visually emphasizes progression or priority across stages, while circular nodes indicate connectivity between levels.
-
Recommended For
Recommended for earth science and environmental presentations, science education seminars, research institution reports, policy briefings, and technology innovation project introductions. Effective for students, researchers, policy makers, and educators communicating complex concepts to audiences.
-
Slide Structure
The central pyramid consists of 6 stages with color differentiation and numbered labels. Three circular icons are positioned on the left and three on the right, connected to each stage with connector lines. Each icon is accompanied by a title and descriptive text area for easy information input.
Related Products
-

Future Execution Plan Overlay Diagram - Innovating Technology and Direction
#Product/Service Introduction #Technical Approach #Diagram
-

Connected Business Timeline – Effective Business Implementation Strategy
#Product/Service Introduction #Business Strategy #Diagram
-

Business Objectives Layer Diagram – Visual Representation of Business and Marketing Strategies
#Business Vision and Strategy #Marketing Plan and Strategy #Diagram
-

Opening Session of the Learning Journey – Welcome and Introduction
#Slide Type #Product/Service Introduction #Diagram
