Technology Comparison Analysis Connection Diagram
RM0500010_14
- Last Update 02/22/2025
- File Size 3.4MB
- # of Slides 2
- File Format PPTX
- Slide Ratio 16:9
- Color
Keywords
- #Content-Based Slides
- #Design-Based Slides
- #Business Introduction
- #Technical Approach
- #Diagram
- #Technological Status
- #Innovative Technologies and Future Plans
- #Cluster
- #Spread
- #Chain Diagram
- #Radial Diagram
- #16:9
- #radial diagram PowerPoint
- #connection diagram slide template
- #technology comparison analysis
- #value expansion diagram
- #strategic planning PowerPoint slide
About the Product
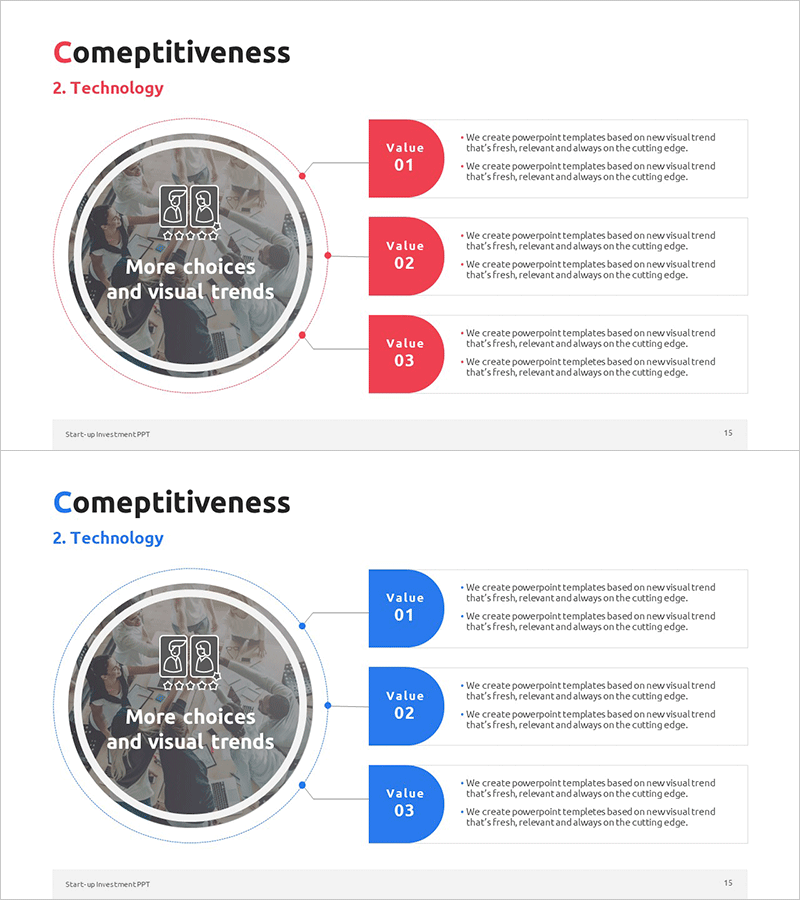
A radial connection diagram PowerPoint slide that expands from a central circular image to three key value points. Available in red and blue color schemes to match your corporate branding. This presentation template is ideal for technology comparison analysis, strategic planning, and core value communication. The 16:9 widescreen format includes 2 slides with fully editable text and image areas, allowing you to customize content for various business presentations.
Usage Points
-
Main Usage
Visualizes the relationship between a central concept and three surrounding elements, ideal for technology comparison, value proposition, and strategic roadmap presentations. The circular focal point combined with balanced three-point layout effectively directs audience attention to your core message.
-
How to Use
Insert your core concept, company logo, or key image in the central circular area. Add your main values, technologies, or strategies in the three colored boxes on the right. Customize text and colors to match your presentation theme for use in technology briefings, executive reports, investor pitches, and strategic planning sessions.
-
Recommended For
Technology managers, strategy planners, marketing professionals, and executives presenting technology innovation, competitive advantages, or future vision. Suitable for startup investor relations, corporate strategy presentations, product technology briefings, and business development meetings.
-
Slide Structure
2-slide template with consistent layout: left side features a circular image area, right side contains 3 value boxes. First slide uses red color scheme, second slide uses blue scheme, allowing flexible reuse across multiple presentation sections while maintaining visual consistency.
Related Products
-

Solar System Illustration Diagram – Visual Aid for Market Analysis
#Business Introduction #Market and Competitor Analysis #Diagram
-

Communication Learning Process Structure
#Technical Approach #Marketing Plan and Strategy #Diagram
-

Business Sector Structure Hexagon Diagram – Visual Trend Introduction
#Company Introduction #Business Introduction #Diagram
-

Diagram of Gaming Device Types – Business Vision and Diversity
#Company Introduction #Business Introduction #Diagram
