Employment Project Results via Participant Reviews
RM0900006_7
- Last Update 03/03/2025
- File Size 2.4MB
- # of Slides 2
- File Format PPTX
- Slide Ratio 16:9
- Color
Keywords
- #Content-Based Slides
- #Design-Based Slides
- #Company Introduction
- #Operational Plan
- #Customer Success Stories
- #Text Box
- #Key Achievements
- #Organizational Structure and Staffing Plan
- #Customer Testimonials and Feedback
- #Speech Bubble
- #16:9
- #participant evaluation PowerPoint slide
- #project results presentation
- #customer feedback analysis slide
- #rating score visualization PPT
- #multi-metric comparison PowerPoint
About the Product
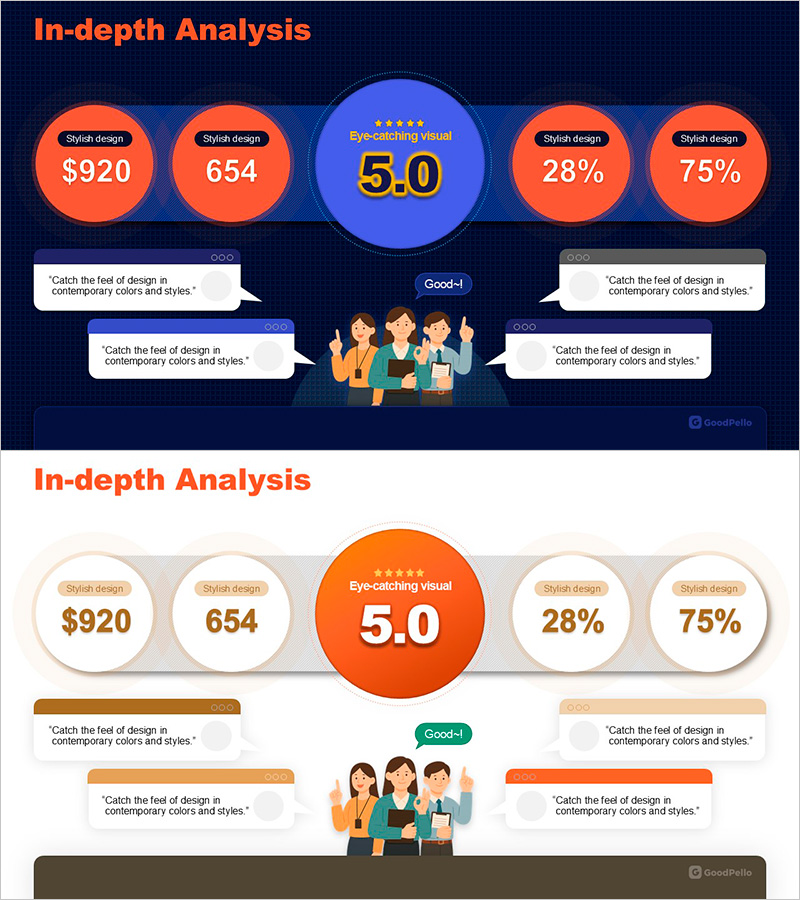
A PowerPoint slide that visualizes project results through participant evaluation data. Featuring a dark blue background with five orange circular charts and a central rating score (5.0) in a comparative layout, this slide can simultaneously display multiple data types including amounts, figures, percentages, and star ratings. The bottom section includes a team illustration and four feedback speech bubbles that intuitively convey customer opinions and participant responses. Available in 16:9 ratio PPTX format for immediate editing, this presentation slide is ideal for employment project results, educational program evaluations, and customer satisfaction survey reports.
Usage Points
-
Main Usage
This slide is designed to comprehensively analyze and present participant evaluation results following project completion. By simultaneously visualizing five evaluation metrics—amounts, figures, percentages, star ratings, and performance indicators—it objectively demonstrates project success and emphasizes team effort and customer satisfaction.
-
How to Use
Use this slide in employment project final presentations, educational program evaluation result sharing, customer satisfaction survey report presentations, and team performance review meetings. Customize each circular chart's figures and labels to match your project evaluation criteria, and populate the bottom feedback speech bubbles with actual participant comments to enhance credibility.
-
Recommended For
Ideal for project managers, training coordinators, HR professionals, and marketing teams presenting performance results. Particularly effective when multiple evaluation criteria must be presented comprehensively, enabling stakeholders and decision-makers to receive trustworthy outcome reports.
-
Slide Structure
The top section contains a title area and five evaluation metric circular charts arranged in a 2-1-2 pattern (two on left, one centered, two on right), with the central circle emphasizing the overall rating score (5.0). The bottom section features a team illustration and four feedback speech bubbles arranged in a two-layer structure for conveying both quantitative and qualitative feedback.
Related Products
-

Square Frame Template for Presenting Customer Success Stories – Speaking Effect
#Customer Success Stories #Text Box #Other
-

Gradient PowerPoint Wide Template – Customer Success Stories
#Customer Success Stories #Text Box #Other
-

Coffee Template Feedback Speech Bubble – Customer Success Case
#Business Strategy #Customer Success Stories #Text Box
-

Introduction to Beer Types Slide – Appeal and Style
#Product/Service Introduction #Customer Success Stories #Text Box
