Price Structuring & Currency Exchange Strategy Presentation Template
RB0100027-1_5
- Last Update 03/03/2025
- File Size 2.1MB
- # of Slides 2
- File Format PPTX
- Slide Ratio 4:3
- Color
Keywords
- #Content-Based Slides
- #Design-Based Slides
- #Product/Service Introduction
- #Diagram
- #Features
- #Product and Service Overview
- #Cluster
- #Closed Cluster Diagram
- #4:3
- #closed cluster diagram PowerPoint
- #9-node diagram slide
- #price strategy presentation
- #currency exchange slide
- #business diagram PowerPoint template
About the Product
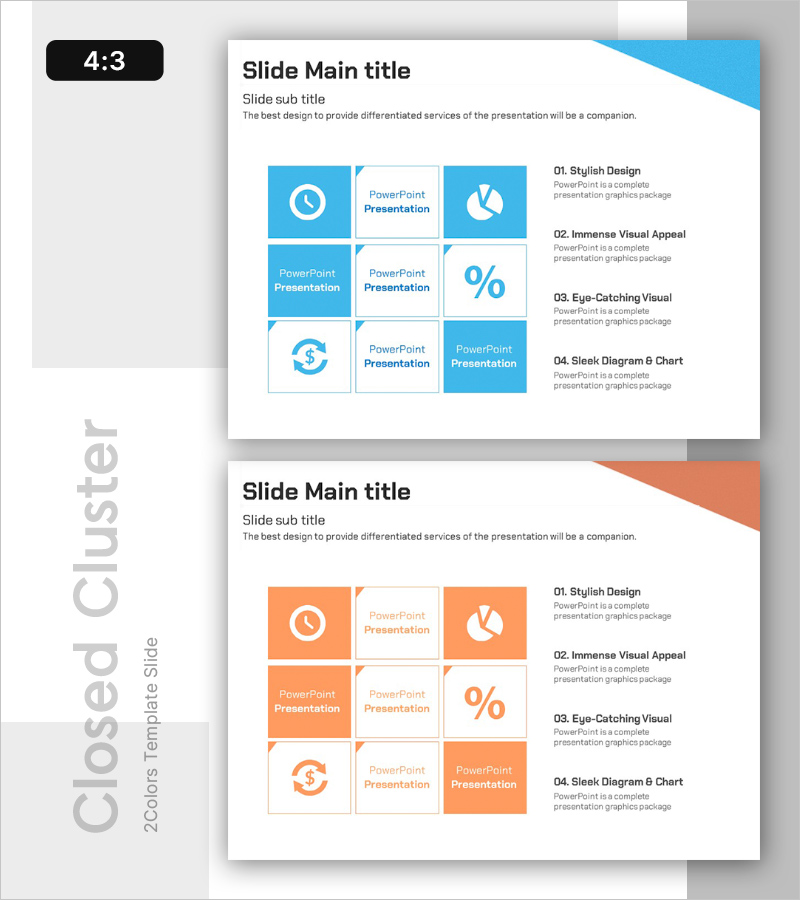
A closed cluster diagram PowerPoint slide designed to visualize price structuring and currency exchange strategy. Presented in two color themes—blue and orange—with 9 nodes arranged in a 3×3 grid layout. The central elements (clock icon, pie chart, currency symbol) anchor the surrounding nodes, creating a cohesive visual structure that clearly represents complex business relationships. Delivered in 4:3 aspect ratio PPTX format, fully editable and ready for immediate use in corporate presentations, strategy meetings, and marketing planning decks.
Usage Points
-
Main Usage
Systematically visualize complex business elements including pricing strategy and currency fluctuation dynamics. The central hub-and-spoke structure enables stakeholders—executives, investors, and team members—to grasp the entire strategic framework at a glance, facilitating informed decision-making.
-
How to Use
Deploy in financial strategy presentations, pricing policy meetings, international trade negotiations, and marketing planning sessions. Customize each node's text and icons to reflect your specific strategic components. Adjust color themes to align with corporate branding for maximum impact and consistency.
-
Recommended For
Finance and planning teams, C-suite executives, marketing managers, management consultants, and international business professionals. Ideal for any presentation scenario requiring clear, simplified communication of intricate business relationships and multi-factor strategic analysis.
-
Slide Structure
Nine nodes arranged in a 3×3 grid configuration. Three central nodes (clock, pie chart, currency icon) represent core strategic elements, while six surrounding nodes provide supporting information. Blue theme emphasizes trust and stability; orange theme conveys activity and optimism. Each node features independently editable text areas for customization.
Related Products
-

Cluster Slide Visualizing 5 Key Points
#Product/Service Introduction #Diagram #Text Box
-

Trial Closure Diagram for Legal Process Explanation
#Product/Service Introduction #Diagram #Features
-

Scientific Data Feature Diagram – Communicating Insights Effectively
#Product/Service Introduction #Diagram #Features
-

Red Purple Paint Brush and Icon Slide – Product and Service Introduction
#Product/Service Introduction #Diagram #Features
