Slide Template for Effectively Delivering Performance Details
RM0800012_6
- Last Update 03/01/2025
- File Size 8.8MB
- # of Slides 2
- File Format PPTX
- Slide Ratio 16:9
- Color
Keywords
- #Content-Based Slides
- #Design-Based Slides
- #Business Strategy
- #Business Management
- #Diagram
- #Achievements
- #Execution Plan
- #Flow
- #Linear Flow
- #16:9
- #circular gauge PowerPoint slide
- #performance analysis presentation
- #expected results visualization
- #KPI dashboard slide
- #data-driven PowerPoint template
About the Product
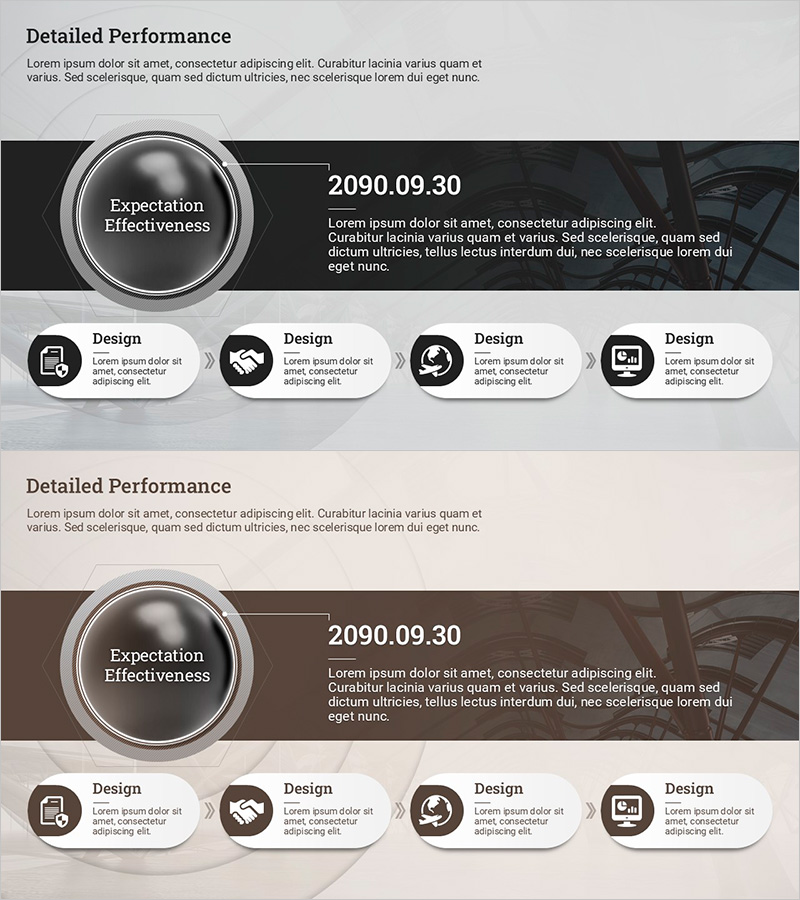
A 2-slide PowerPoint presentation template designed to communicate performance data and expected results intuitively. The layout combines a central circular gauge diagram with a right-aligned text area to clearly express key metrics and numerical outcomes. Dark background with white typography and icon elements creates visual hierarchy and emphasis. Slide 1 displays primary performance indicators using the circular gauge, while Slide 2 presents four design elements with accompanying icons in a horizontal layout. Ideal for business presentations, performance reports, and executive briefings. Available in 16:9 widescreen PPTX format for immediate use.
Usage Points
-
Main Usage
Visualize performance metrics, expected results, and numerical outcomes using a circular gauge diagram to communicate data intuitively to audiences. The central gauge emphasizes a single indicator such as goal achievement rate, efficiency, or satisfaction level, while the right text area provides detailed explanations, figures, and timelines to establish clear information hierarchy.
-
How to Use
On Slide 1, input your primary performance metric into the circular gauge and add corresponding numerical values. Slide 2 lists four design elements, implementation strategies, or performance indicators with icons arranged horizontally for multi-dimensional analysis. The dark background and white text contrast works effectively for projector presentations, online meetings, and printed materials.
-
Recommended For
Executives, project managers, and marketing professionals presenting quarterly or annual performance reports, business outcome analysis, and ROI validation. Perfectly suited for the performance analysis section of business plans, performance reports, and investor pitch decks.
-
Slide Structure
Slide 1: Central circular gauge (single metric display) + right-aligned text area (numerical values, timeline, description). Slide 2: Four icon-labeled items (design, implementation, results, other) arranged horizontally with descriptive text below each. Full 16:9 aspect ratio, dark background (black/dark gray) + white typography + gray accent lines.
Related Products
-

Company History Arrow Diagram – Business Growth Flow
#Company Introduction #Business Strategy #Diagram
-

Chemical Lab PowerPoint Template – Journey of Research and Exploration
#Business Strategy #Business Management #Diagram
-

Planning and Process Diagrams – Blue, Orange, Green
#Business Management #Operational Plan #Diagram
-

Colors Theme Presentation Template Sequence Diagram – Ideal for Business Execution Strategy
#Business Strategy #Business Management #Diagram
