Timeline of Health Routine Evolution – Visualizing Business Strategies
RB0600007_4
- Last Update 03/14/2025
- File Size 0.8MB
- # of Slides 2
- File Format PPTX
- Slide Ratio 4:3
- Color
Keywords
- #Content-Based Slides
- #Design-Based Slides
- #Company Introduction
- #Business Strategy
- #Diagram
- #Other
- #History
- #Cluster
- #Chain Diagram
- #Silhouette
- #Project Progress
- #4:3
- #pathway diagram PowerPoint
- #3-stage roadmap slide
- #business progress visualization
- #timeline diagram template
- #milestone PowerPoint slide
About the Product
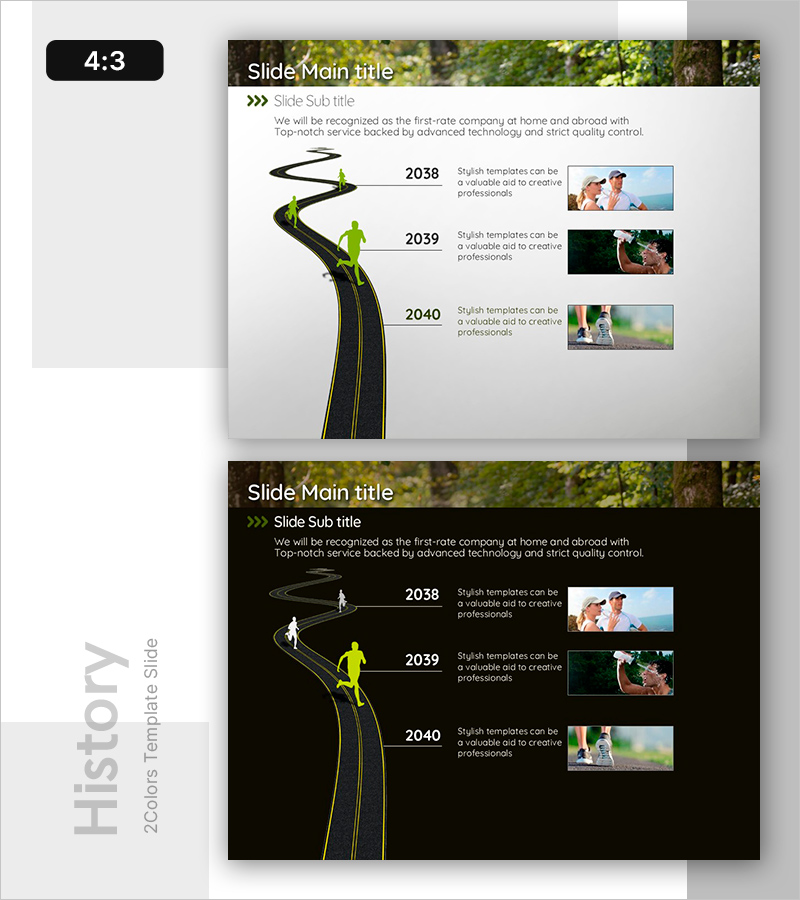
A 3-stage pathway diagram PowerPoint slide that visualizes business progress and transformation milestones over time. The design features a black road with yellow and green accent silhouettes representing key stages, combined with year-based milestones to convey sequential advancement clearly. A nature background image on the left side reinforces trust and growth, while the right section provides space for stage-specific descriptions and supporting images. The 2-slide set includes both light and dark background versions, making it adaptable to various presentation environments and corporate settings.
Usage Points
-
Main Usage
Effectively visualizes organizational business strategies, transformation processes, and growth roadmaps in distinct stages. The pathway format simultaneously conveys timeline progression and phase advancement, enhancing audience comprehension and engagement.
-
How to Use
Integrate into business plans, management reports, or strategy presentations within 'Business Progress' or 'Vision Realization Roadmap' sections. Customize each stage area with actual data, achievement photos, and key messages to create tailored presentation materials.
-
Recommended For
Ideal for executive briefings, investor presentations, and organizational strategy-sharing meetings. Particularly effective when emphasizing phased growth, project status, or transformation processes. Suitable for marketing, HR, and operations departments presenting strategic initiatives.
-
Slide Structure
Three nodes (2038, 2039, 2040) connected by a curved black pathway. Each node includes a silhouette figure, year label, descriptive text, and image placeholder positioned on the right. The layout combines a left-side background image with a right-side information section in a two-column structure.
Related Products
-

Silhouette History Diagram – Visualizing Evolution
#Company Introduction #Diagram #Other
-

Journey to a Goal Slide – Emphasizing Business Strategy
#Business Vision and Strategy #Business Strategy #Diagram
-

Adventure Company History 4 Color Connection Diagram
#Company Introduction #Business Strategy #Diagram
-

Journey of Change by Year – Business Strategy Visualization
#Company Introduction #Business Strategy #Diagram
