Flue Flow and Nesting Diagram – Visualization of Business Strategy Development
RJ0500025_10
- Last Update 06/13/2025
- File Size 0.4MB
- # of Slides 2
- File Format PPTX
- Slide Ratio 16:9
- Color
Keywords
- #Content-Based Slides
- #Design-Based Slides
- #Company Introduction
- #Business Strategy
- #Diagram
- #History
- #Flow
- #Linear Flow
- #Project Progress
- #16:9
- #timeline flow diagram PowerPoint
- #nesting diagram slide template
- #business development visualization
- #5-stage timeline PPT
- #project roadmap PowerPoint slide
About the Product
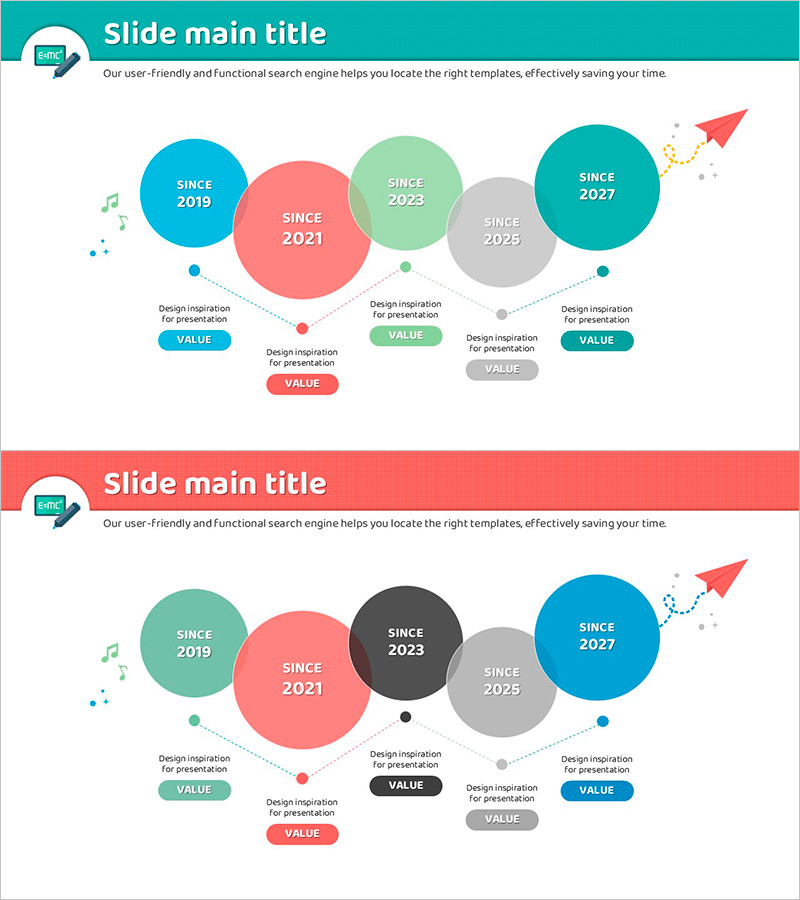
A 5-stage timeline flow nesting diagram PowerPoint slide that clearly visualizes business development progress over time. Colorful circular nodes in teal, coral, mint green, gray, and teal are connected with dotted lines and directional arrows to represent each year's key achievements and strategic values. Editable badge-shaped text boxes below each node allow you to input milestone information and core messages. This presentation slide is ready to use for business strategy presentations, project roadmaps, and organizational growth narratives.
Usage Points
-
Main Usage
This diagram is optimized for visualizing business development progress by year and stage. Five circular nodes represent the timeline, with editable badge-shaped text boxes below each node for entering years, achievements, and core values. It effectively communicates an organization's growth journey and strategic milestones.
-
How to Use
Enter years (2019, 2021, 2023, 2025, 2027) in each circular node and add key achievements or strategic keywords in the badge boxes below. Colors can be customized by department, project, or priority level. Dotted connectors and directional arrows emphasize progression. Use in business briefings, investor presentations, and organizational culture-sharing sessions.
-
Recommended For
Recommended for executives, business planning teams, marketing managers, and project leads presenting business strategy and progress updates. Particularly effective for long-term business plans, new business initiative timelines, organizational growth stories, and product development roadmaps.
-
Slide Structure
Two-slide layout with five circular nodes (teal, coral, mint green, gray, teal) arranged left to right and connected by dotted lines. Four badge-shaped text boxes are positioned below each node for editable content. An upward-trending arrow icon appears in the upper right. The second slide features the same structure with alternative color combinations for design flexibility.
Related Products
-

Adventure Company History 4 Color Connection Diagram
#Company Introduction #Business Strategy #Diagram
-

Green & Gray Template Wide History
#Company Introduction #Business Strategy #Diagram
-

The Past and Present of Technological Advancements – Linear Flow Diagram
#Company Introduction #Business Strategy #Diagram
-

Infinite Energy Wide PPT History – The Trajectory of Corporate Growth
#Company Introduction #Business Strategy #Diagram
