Visualizing Competitive Advantage Points with Diagram Slide - Premium Design
RM0800007_6
- Last Update 02/28/2025
- File Size 2.4MB
- # of Slides 2
- File Format PPTX
- Slide Ratio 16:9
- Color
Keywords
- #Content-Based Slides
- #Design-Based Slides
- #Product/Service Introduction
- #Business Vision and Strategy
- #Diagram
- #Differentiation Strategy for Products/Services
- #Business Strategy
- #Cluster
- #Closed Cluster Diagram
- #16:9
- #closed cluster diagram PowerPoint
- #3-node diagram slide
- #competitive advantage diagram
- #business diagram PowerPoint slide
- #how to create cluster diagram in PowerPoint
About the Product
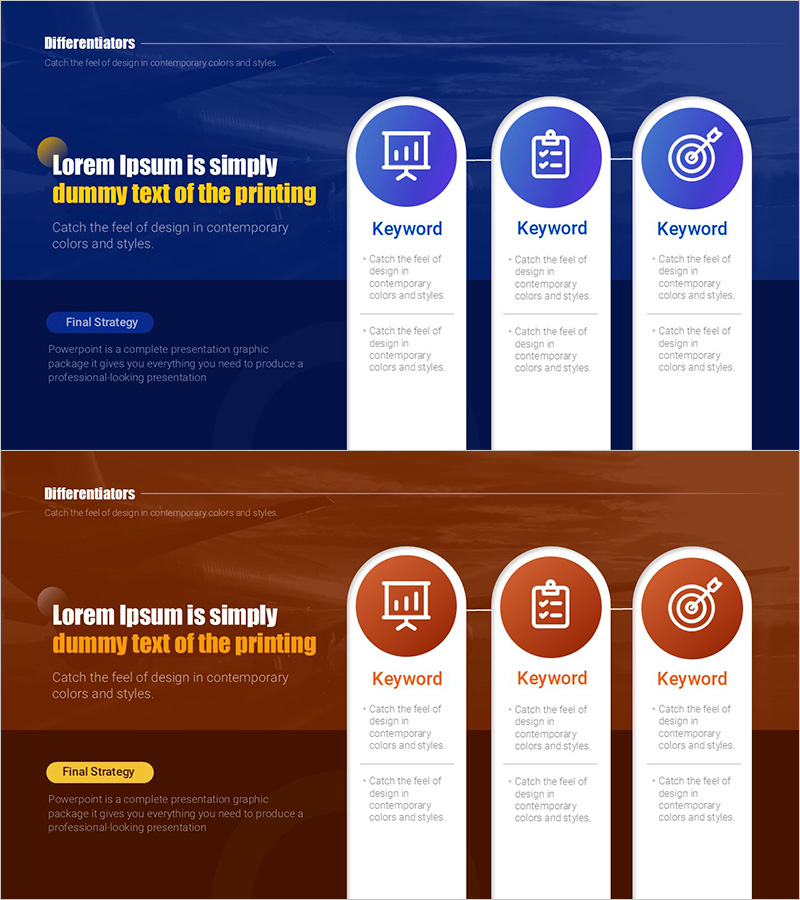
A PowerPoint slide that visualizes competitive advantage points using a 3-node closed cluster structure. The symmetrical layout features a central circular icon with two side nodes connected on both left and right, clearly expressing the relationship between core strategy and supporting elements. Provided in two color versions—dark blue and orange—each node includes an icon and text input area. This 2-slide set is ready to use immediately in business presentations, business plans, proposals, and other professional documents as a PPT diagram slide.
Usage Points
-
Main Usage
Expresses the relationship and interaction of three elements—competitive advantage points, core strategies, or organizational roles—using a center-focused structure. The closed-node connection effectively emphasizes integrated systems, circular processes, and unified strategies.
-
How to Use
Enter strategy names, department titles, or roles in each node's text input area, and replace icons to match your context. Select the dark blue version to emphasize corporate credibility or the orange version to highlight activity and innovation.
-
Recommended For
Ideal for executive and strategy team business plans, marketing proposals, consulting reports, organizational restructuring presentations, and new business initiative strategy presentations. Suitable for any business presentation requiring emphasis on balance and interaction among three elements.
-
Slide Structure
2-slide set. Each slide features a closed cluster structure with one central circular icon and two symmetrically positioned side nodes (3 nodes total). Connection lines between nodes express relationships, and each node includes a text input area and icon replacement zone.
Related Products
-

Information Search Differentiation Strategy – Efficient Data Exploration
#Product/Service Introduction #Business Vision and Strategy #Business Strategy
-

Introduction to Hexagonal Education Programs PowerPoint Template – Embracing Innovative Approaches
#Product/Service Introduction #Business Vision and Strategy #Diagram
-

Visualizing Strategic Flow with Encountering Arrow Diagram
#Product/Service Introduction #Business Vision and Strategy #Diagram
-

Cybersecurity Service Differentiation Strategy PowerPoint Template
#Product/Service Introduction #Business Vision and Strategy #Diagram
