Experimental Setup Diagram – Technology and Innovation
RJ0400025_19
- Last Update 05/24/2025
- File Size 6.7MB
- # of Slides 2
- File Format PPTX
- Slide Ratio 16:9
- Color
Keywords
- #Content-Based Slides
- #Design-Based Slides
- #Product/Service Introduction
- #Technical Approach
- #Diagram
- #Composition
- #System Architecture Diagram
- #Structure
- #Cluster
- #Tree Diagram
- #Chain Diagram
- #16:9
- #connection diagram PowerPoint
- #system architecture slide
- #4-node diagram template
- #technology system PPT
- #innovation structure diagram
- #node connection presentation
- #how to create system diagram in PowerPoint
About the Product
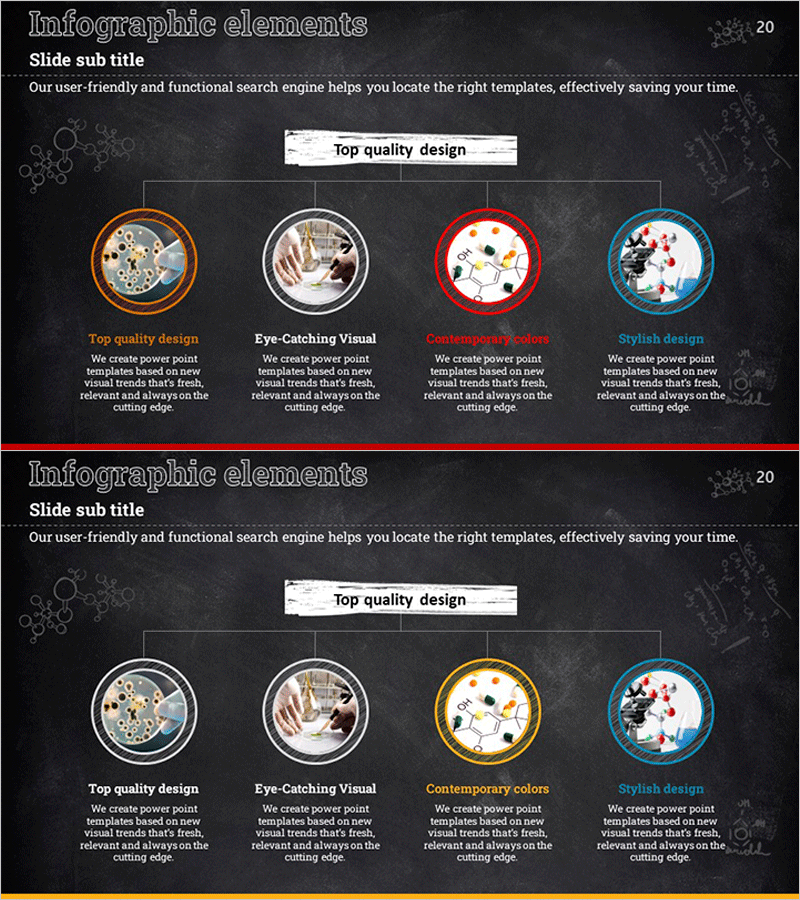
A 4-node connection diagram PowerPoint slide designed to visualize technology and innovation system structures. The slide features a dark background with four circular nodes in orange, gray, red, and blue colors, each connected to a central title box. Each node contains embedded icons representing gear, hand, chart, and people elements. This 2-slide PPTX template is fully editable and ideal for presenting experimental setups, technology components, innovation strategies, and complex system relationships. Perfect for presentations, planning documents, and technical reports that require clear visualization of interconnected system elements.
Usage Points
-
Main Usage
Illustrates relationships between four key elements of a technology system, innovation process, or experimental setup using a hub-and-spoke layout. The central concept connects to four distinct components, making it ideal for explaining complex system interactions and interdependencies in a clear, hierarchical manner.
-
How to Use
Enter your core concept in the central title box (e.g., Technology Innovation Strategy) and assign specific elements to each of the four nodes (e.g., Technology, People, Data, Operations). Customize node text and icons to adapt the diagram for different industries, departments, or project requirements.
-
Recommended For
Ideal for technology strategy presentations, R&D reports, innovation roadmaps, system architecture explanations, organizational structure overviews, and project component analysis. Suitable for executives, planners, engineers, and technical professionals in IT, manufacturing, research and development, and consulting sectors.
-
Slide Structure
2-slide presentation with dark charcoal background. Each slide features one central title box and four circular nodes arranged in a cross pattern. Nodes contain embedded icons (gear, hand, chart, people) and are connected to the center via linear connector lines. Optimized for 16:9 widescreen format, compatible with modern projectors and displays.
Related Products
-

Business Process 3D Diagram – Innovation and Structure
#Operational Plan #Technical Approach #Diagram
-

Insight into 3D Printer System Configuration Diagram
#Product/Service Introduction #Technical Approach #Diagram
-

IoT Service Configuration Diagram – Visual Explanation for Technology Sector
#Product/Service Introduction #Technical Approach #Diagram
-

Mind Map Diagram Slide Template for Effective Presentations
#Company Introduction #Product/Service Introduction #Diagram
