Global Shipping Logistics Performance – Business Introduction and Competitiveness Analysis
RM0700013_7
- Last Update 02/27/2025
- File Size 0.6MB
- # of Slides 2
- File Format PPTX
- Slide Ratio 16:9
- Color
Keywords
About the Product
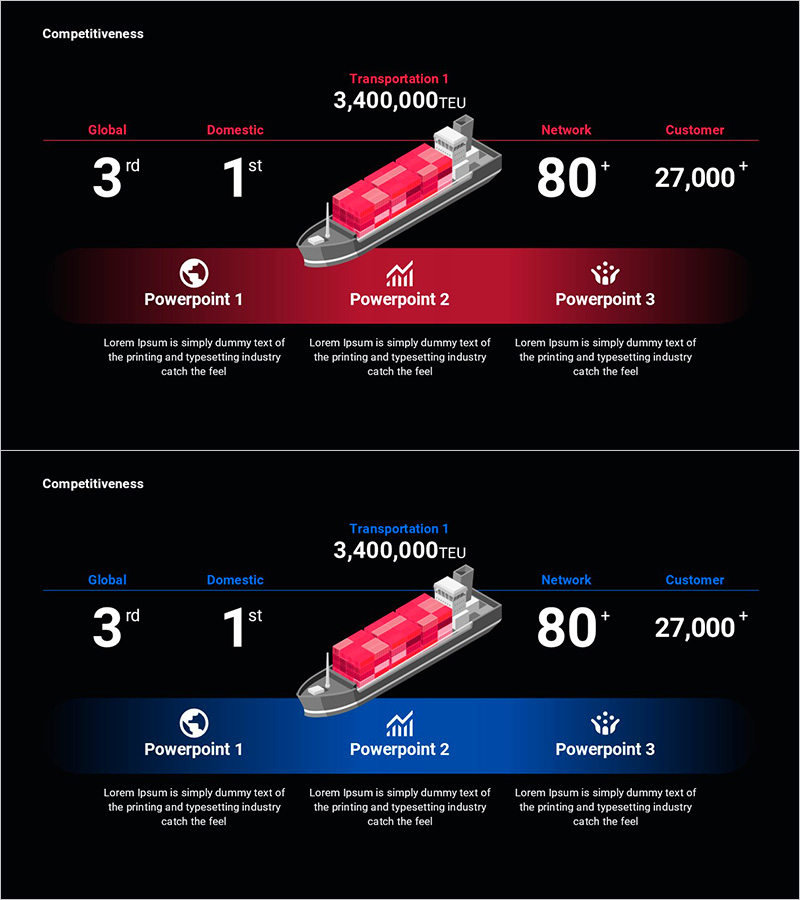
A PowerPoint slide visualizing the competitiveness of a global shipping logistics company through 5 key metrics: global ranking, domestic ranking, transportation volume, network scale, and customer base. Designed with a black background and dual-tone red and blue color scheme, the slide features a central ship illustration and a horizontal timeline structure at the top to convey information hierarchically. The layout includes 3 PowerPoint sections (Powerpoint 1, 2, 3) for detailed explanations, making it immediately applicable for business introduction and performance presentations. Provided in 16:9 PPTX format with fully editable text and numerical data fields.
Usage Points
-
Main Usage
Demonstrates a global logistics company's competitive position through objective metrics (ranking, volume, network, customer count). Enables investors, partners, and stakeholders to quickly grasp the company's market position and performance achievements in business introduction presentations.
-
How to Use
The top horizontal timeline displays 5 key metrics, while the central ship illustration emphasizes the logistics business characteristics visually. The bottom 3 sections provide detailed explanations for each metric (global ranking, domestic ranking, transportation volume, network coverage, customer base) in text format.
-
Recommended For
Ideal for global logistics, shipping, and maritime company business introductions, investor pitch decks, partnership proposals, and annual performance reports. Particularly recommended for executive and investor presentations where emphasizing international competitiveness and market position is critical.
-
Slide Structure
Black background layout with 5 metrics arranged horizontally at top (Global, Domestic, Transportation Volume, Network, Customer), central 3D ship illustration, and 3 PowerPoint sections at bottom (icon + title + description text). Contains 8 text input areas (5 top metrics + 3 bottom section titles) and 5 editable numerical data fields.
Related Products
-

Premium Management Template with Donut Chart for Performance Visualization
#Business Introduction #Business Strategy #Graph
-

AI Chatbot Diagnosis PowerPoint Slide – KPI Gauge Layout
#Business Introduction #Business Strategy #Technological Status
-

Social Network Business Analysis – Vertical Bar Chart
#Business Introduction #Business Strategy #Graph
-

Market Analysis Vertical Bar Graph
#Business Strategy #Market and Competitor Analysis #Graph
