AI Chatbot Diagnosis PowerPoint Slide – KPI Gauge Layout
RBTK0300002_4
- Last Update 05/04/2026
- File Size 13.5MB
- # of Slides 2
- File Format PPTX
- Slide Ratio 16:9
- Color
Keywords
About the Product
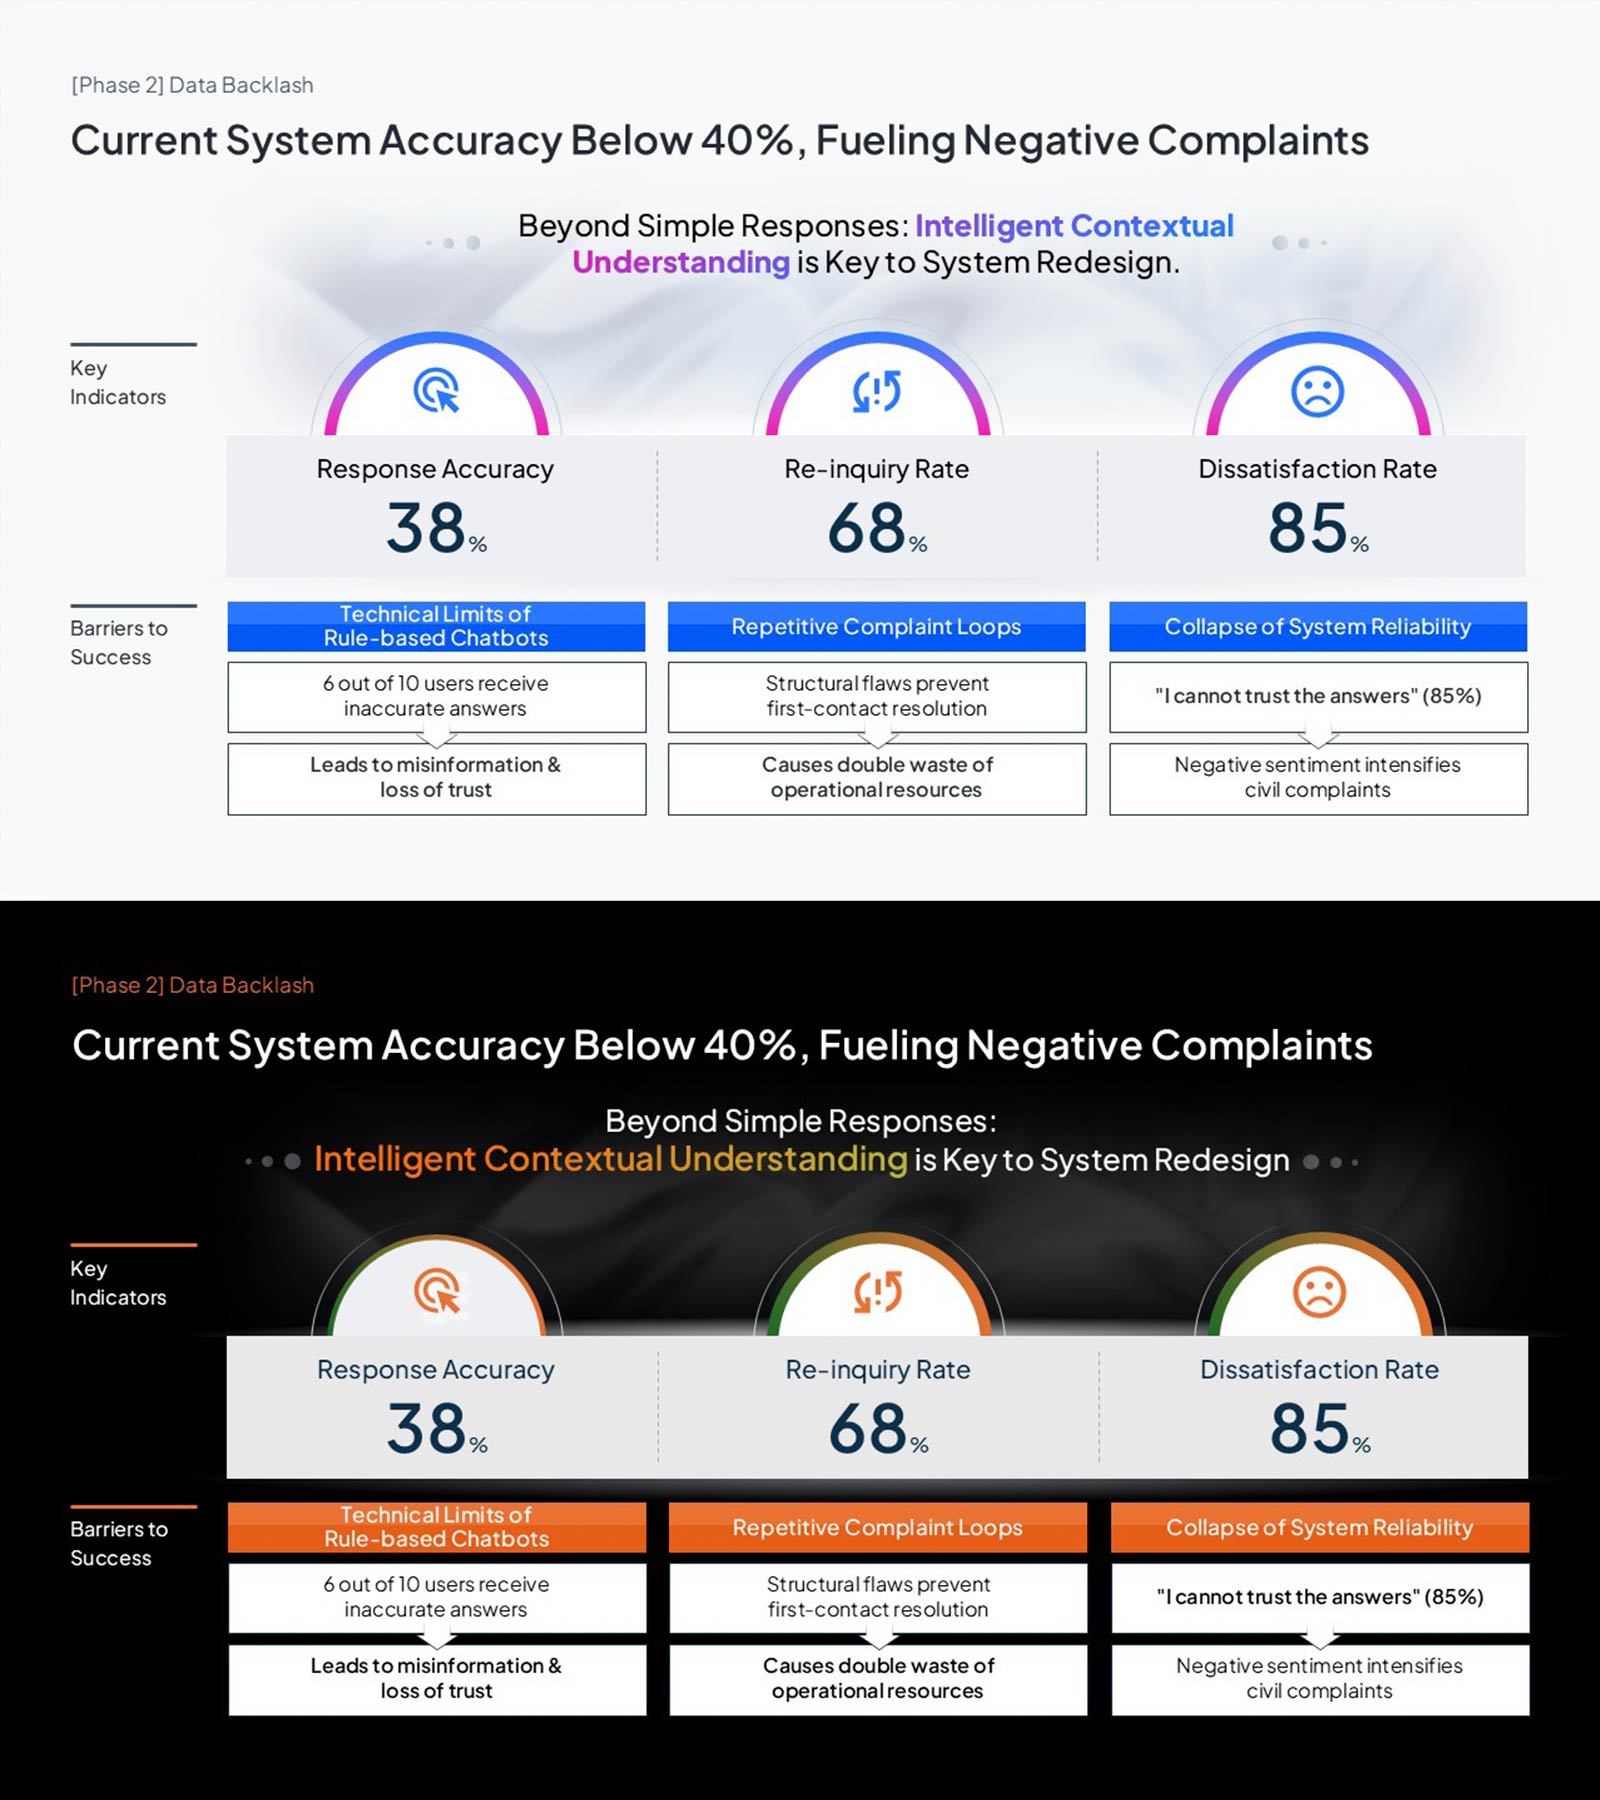
AI chatbot diagnosis PowerPoint slide with three KPI gauges: Response Accuracy 38%, Re-inquiry Rate 68%, Dissatisfaction Rate 85%. Phase 2 headline frames the current system failure context. Key Indicators shows these metrics as semicircular gauge icons; Barriers to Success below diagnoses three root causes—chatbot technical limits, complaint loops, and reliability collapse—via a three-column cause card layout. Light (white, blue-purple accents) and dark (black, orange accents) color versions included. Editable in PowerPoint for AI startup pitch decks, investor IR reports, and service innovation presentations.
Usage Points
-
Main Usage
Use as the current-state analysis section in AI pitch decks and investor reports. Quantifies chatbot KPIs and diagnoses three root causes on one structured PowerPoint slide.
-
How to Use
Replace the Phase 2 headline with your current context. Edit the three KPI gauge values and labels with your metrics, and update the Barriers to Success cause card content in PowerPoint.
-
Recommended For
Ideal for AI startup founders, product managers, and digital service teams presenting chatbot performance data and system failure evidence to investors or executives.
-
Slide Structure
One slide. Top: Phase 2 label and headline. Middle: three semicircular KPI gauges (38%, 68%, 85%). Bottom: three-column Barriers to Success cause cards. Light and dark color versions included.
Related Products
-

Premium Management Template with Donut Chart for Performance Visualization
#Business Introduction #Business Strategy #Graph
-

Social Network Business Analysis – Vertical Bar Chart
#Business Introduction #Business Strategy #Graph
-

Global Shipping Logistics Performance – Business Introduction and Competitiveness Analysis
#Business Introduction #Business Strategy #Technological Status
-

Sports Analysis Bar Chart – Easy Performance Monitoring Option
#Business Strategy #Market and Competitor Analysis #Graph
